Fig. 3.
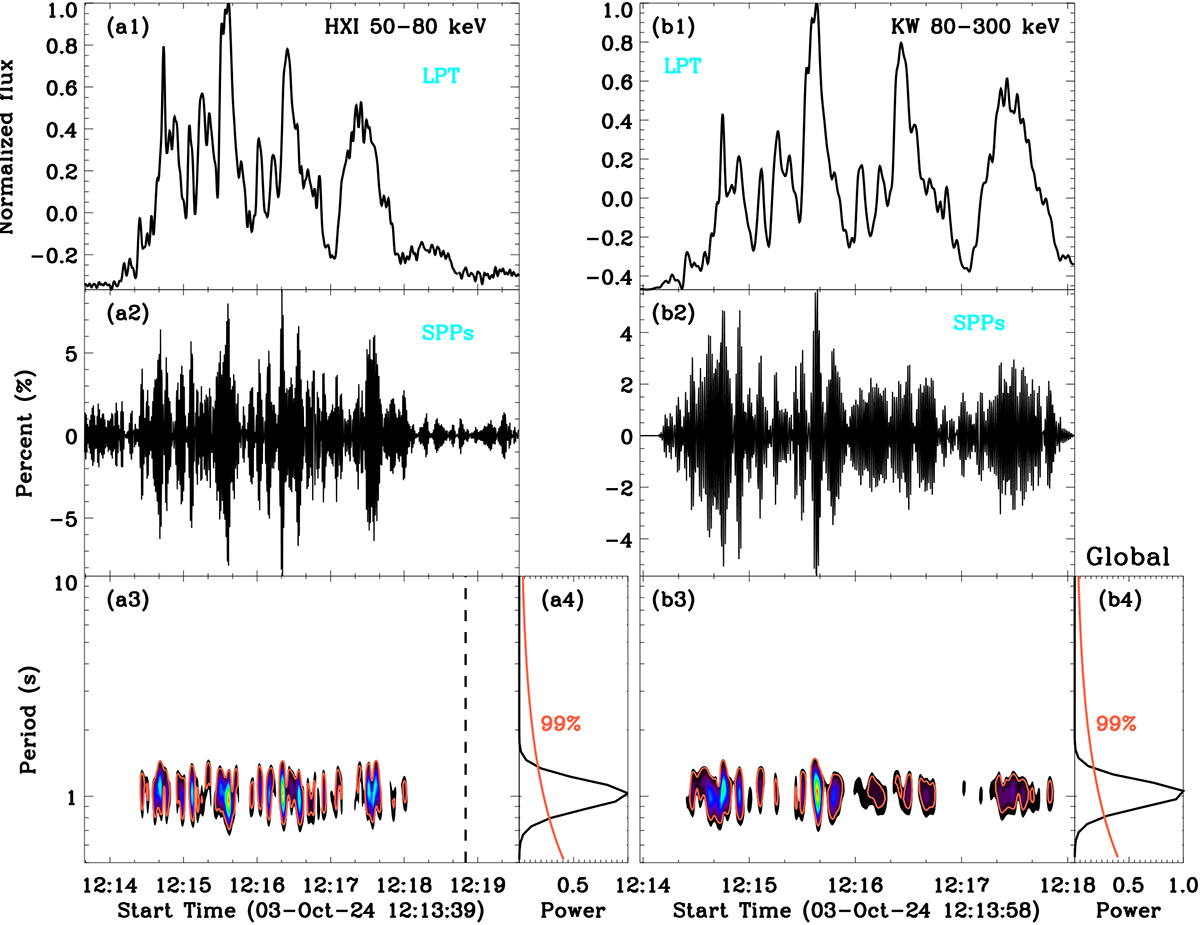
Download original image
Morlet wavelet analysis results. (a1–b2): Long-period trend (LPT) and SPPs derived from raw light curves with the FFT filter method. They have been normalized by the maximum value of the LPT component. (a3 and b3): Morlet wavelet power spectra. (a4 and b4) Global wavelet power spectra. The tomato contours and lines indicate the significance level of 99%.
Current usage metrics show cumulative count of Article Views (full-text article views including HTML views, PDF and ePub downloads, according to the available data) and Abstracts Views on Vision4Press platform.
Data correspond to usage on the plateform after 2015. The current usage metrics is available 48-96 hours after online publication and is updated daily on week days.
Initial download of the metrics may take a while.