Fig. 1.
Download original image
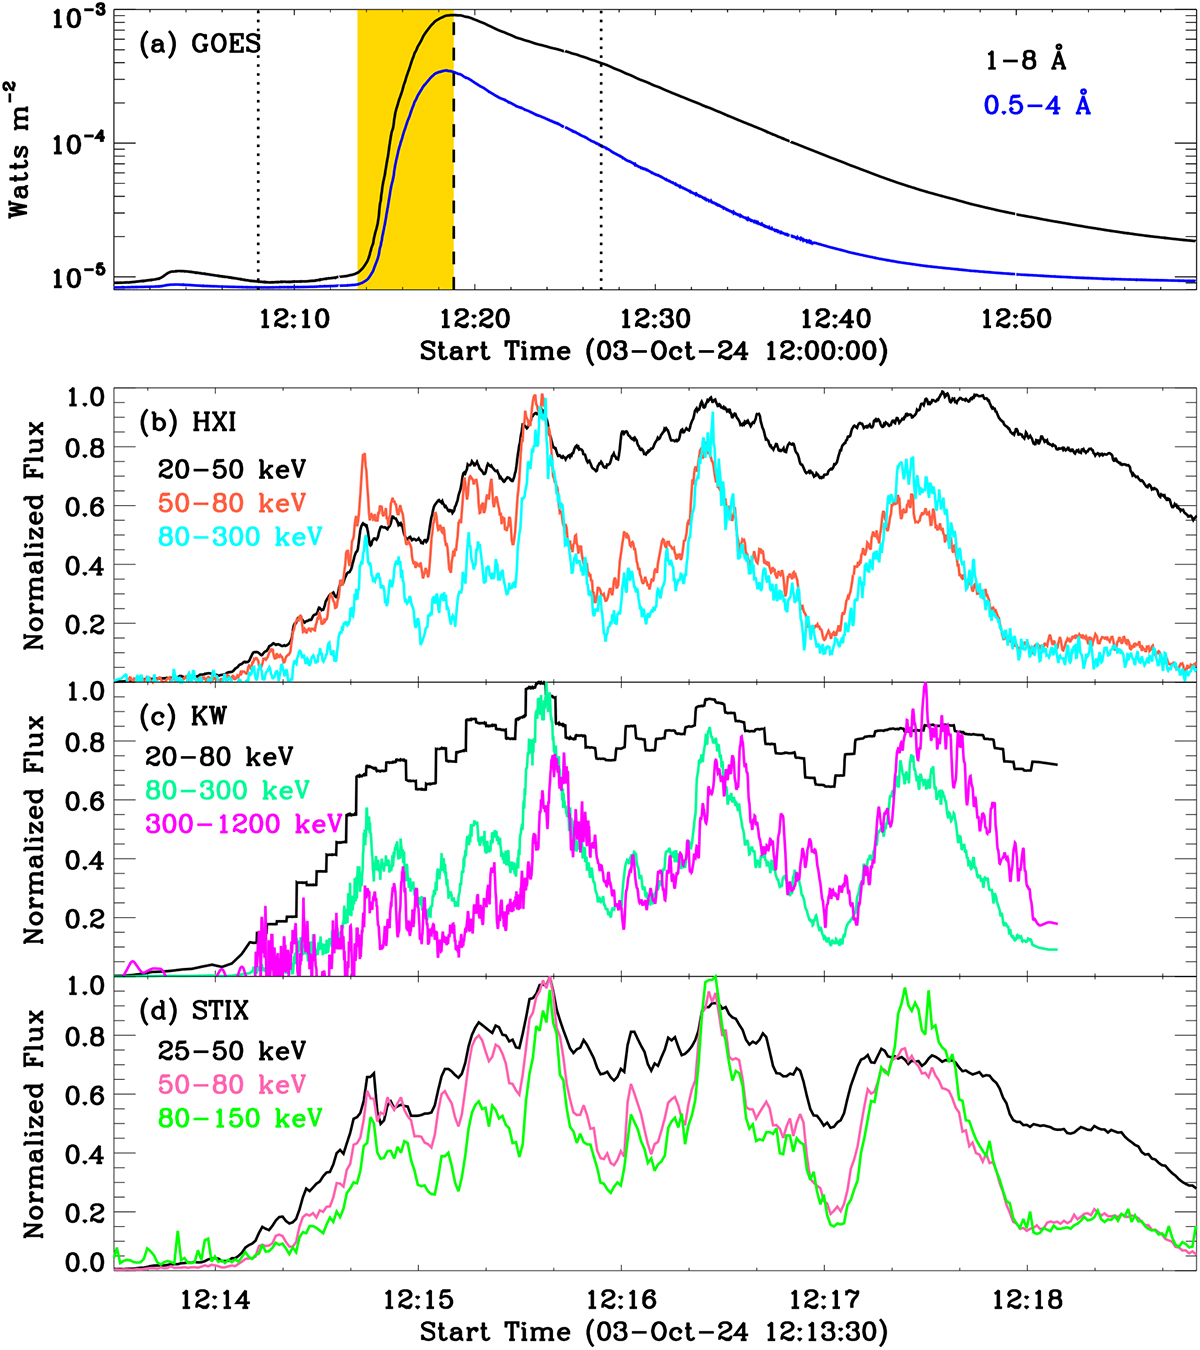
Light curves of the solar flare on October 3, 2024. (a): Full-disk light curves during 12:00–13:00 UT measured by GOES in wavelengths of 1–8 Å (black) and 0.5–4 Å (blue). The vertical lines mark the start, peak, and stop times of the X9.0 flare. (b): Light curves from 12:13:30 UT to 12:18:50 UT measured by ASO-S/HXI in the energy range of 20–50 keV (black), 50–80 keV (tomato), and 80–300 keV (cyan). (c): Light curves between 12:13:30 UT and 12:18:50 UT recorded by KW in channels of 20–80 keV (black), 80–300 keV (spring green), and 300–1200 keV (magenta). (c): Light curves between 12:13:30 UT and 12:18:50 UT observed by STIX in channels of 20–50 keV (black), 50–80 keV (hot pink), and 80–150 keV (green).
Current usage metrics show cumulative count of Article Views (full-text article views including HTML views, PDF and ePub downloads, according to the available data) and Abstracts Views on Vision4Press platform.
Data correspond to usage on the plateform after 2015. The current usage metrics is available 48-96 hours after online publication and is updated daily on week days.
Initial download of the metrics may take a while.