Fig. 7
Download original image
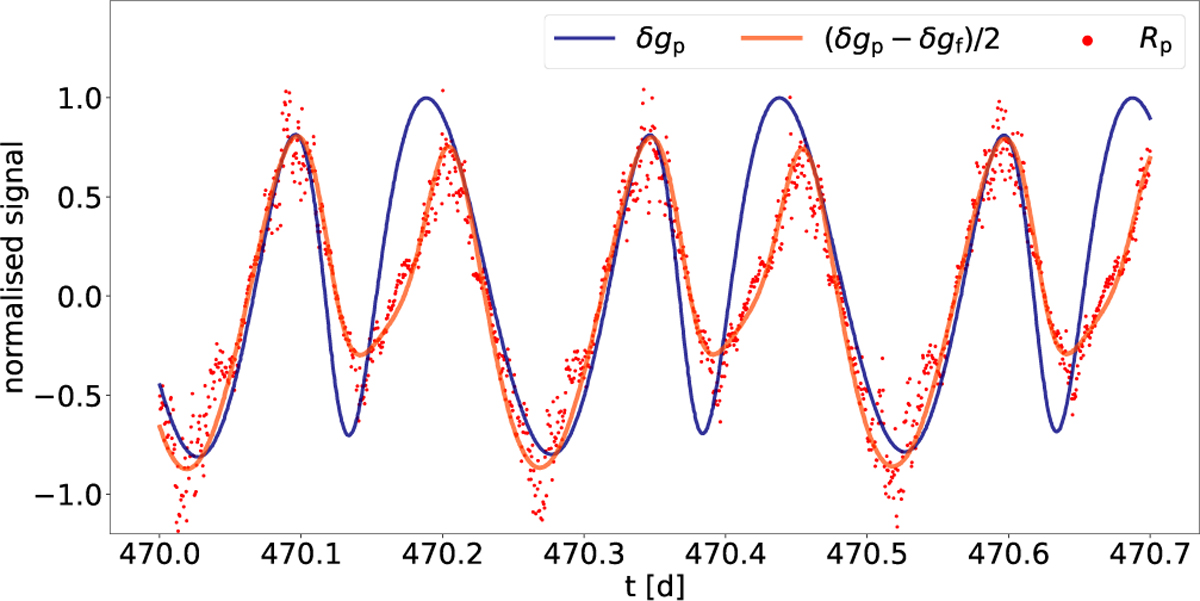
Example of the GW signal from one of the simulations and how it appears in the astrometric solution. The black curve (δ𝑔p) is the AL component of the GW signal in the preceding FoV. The red dots (Rp) show the AL residuals of the solution in the same FoV. For comparison, the red curve shows half the differential GW effect, (δ𝑔p − δ𝑔f)/2. All data are normalised by ∆max. The frequency of the GW signal was ν = 101.160 nHz, equivalent to a period of Pgw ≃ 114.42 d.
Current usage metrics show cumulative count of Article Views (full-text article views including HTML views, PDF and ePub downloads, according to the available data) and Abstracts Views on Vision4Press platform.
Data correspond to usage on the plateform after 2015. The current usage metrics is available 48-96 hours after online publication and is updated daily on week days.
Initial download of the metrics may take a while.