Fig. 6
Download original image
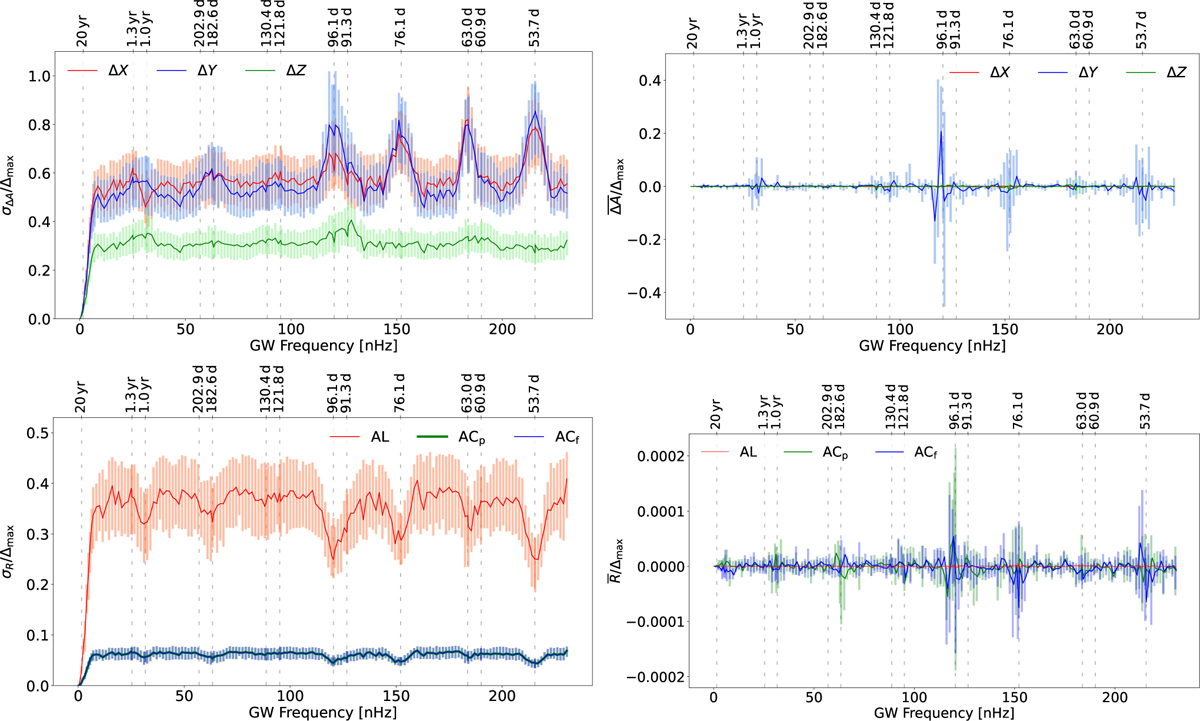
Statistics of the attitude errors (top) and astrometric residuals (bottom) versus the frequency of the injected GW. Left: standard deviations of the errors or residuals. Right: averages of the errors or residuals. In the upper panels, A in ∆A is a placeholder for X, Y, or Z, the three axes of the Scanning Reference System (Sect. 3.1 of Lindegren et al. 2012). Similarly, in the lower panels, R is a placeholder for the residual along-scan (AL), across-scan in the preceding FoV (ACp), or across-scan in the following FoV (ACf). The coloured bars show the range of statistics obtained in the five simulations for each frequency (see Sect. 4); for improved visibility the coloured lines connect the average statistics in the corresponding bars. The standard deviations of the residuals in ACp and ACf virtually coincide.
Current usage metrics show cumulative count of Article Views (full-text article views including HTML views, PDF and ePub downloads, according to the available data) and Abstracts Views on Vision4Press platform.
Data correspond to usage on the plateform after 2015. The current usage metrics is available 48-96 hours after online publication and is updated daily on week days.
Initial download of the metrics may take a while.