Fig. 5
Download original image
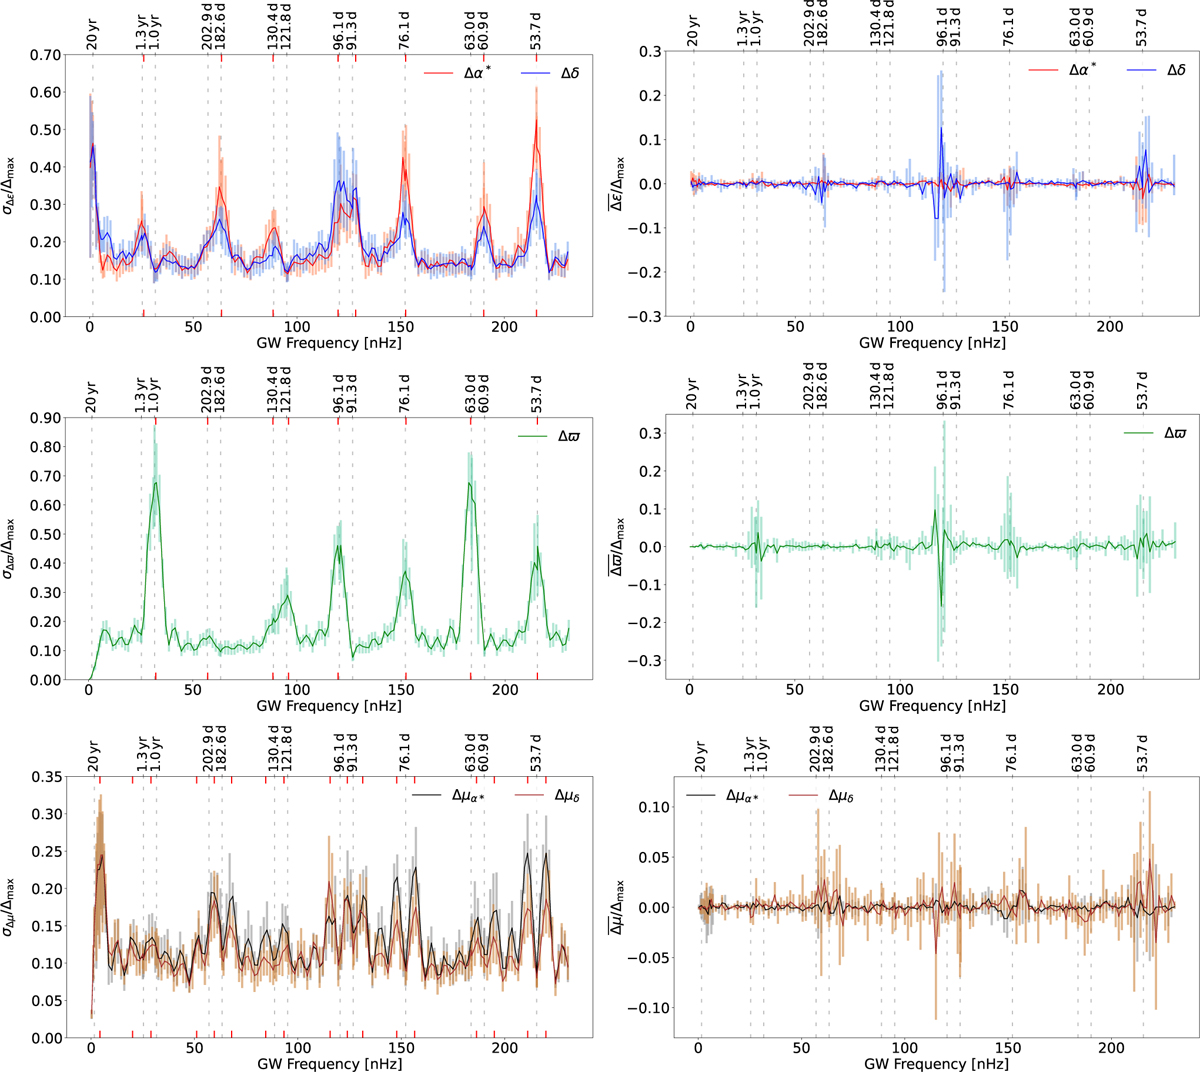
Statistics of the errors of the astrometric source parameters versus the frequency of the injected GW. Left: standard deviations of the errors. Right: averages of the errors. Top to bottom: errors in position (α and δ), parallax (ϖ), and proper motion (µα* and µδ). All statistics are normalised to the maximum astrometric amplitude of the GW effect, ∆max . The coloured bars show the range of statistics obtained in the five simulations for each frequency (see Sect. 4); for improved visibility the coloured lines connect the average statistics in the corresponding bars. The red tick marks on both lower and upper horizontal axes of the left pictures show the positions of the GW frequencies and periods shown in Table 2.
Current usage metrics show cumulative count of Article Views (full-text article views including HTML views, PDF and ePub downloads, according to the available data) and Abstracts Views on Vision4Press platform.
Data correspond to usage on the plateform after 2015. The current usage metrics is available 48-96 hours after online publication and is updated daily on week days.
Initial download of the metrics may take a while.