Fig. 3
Download original image
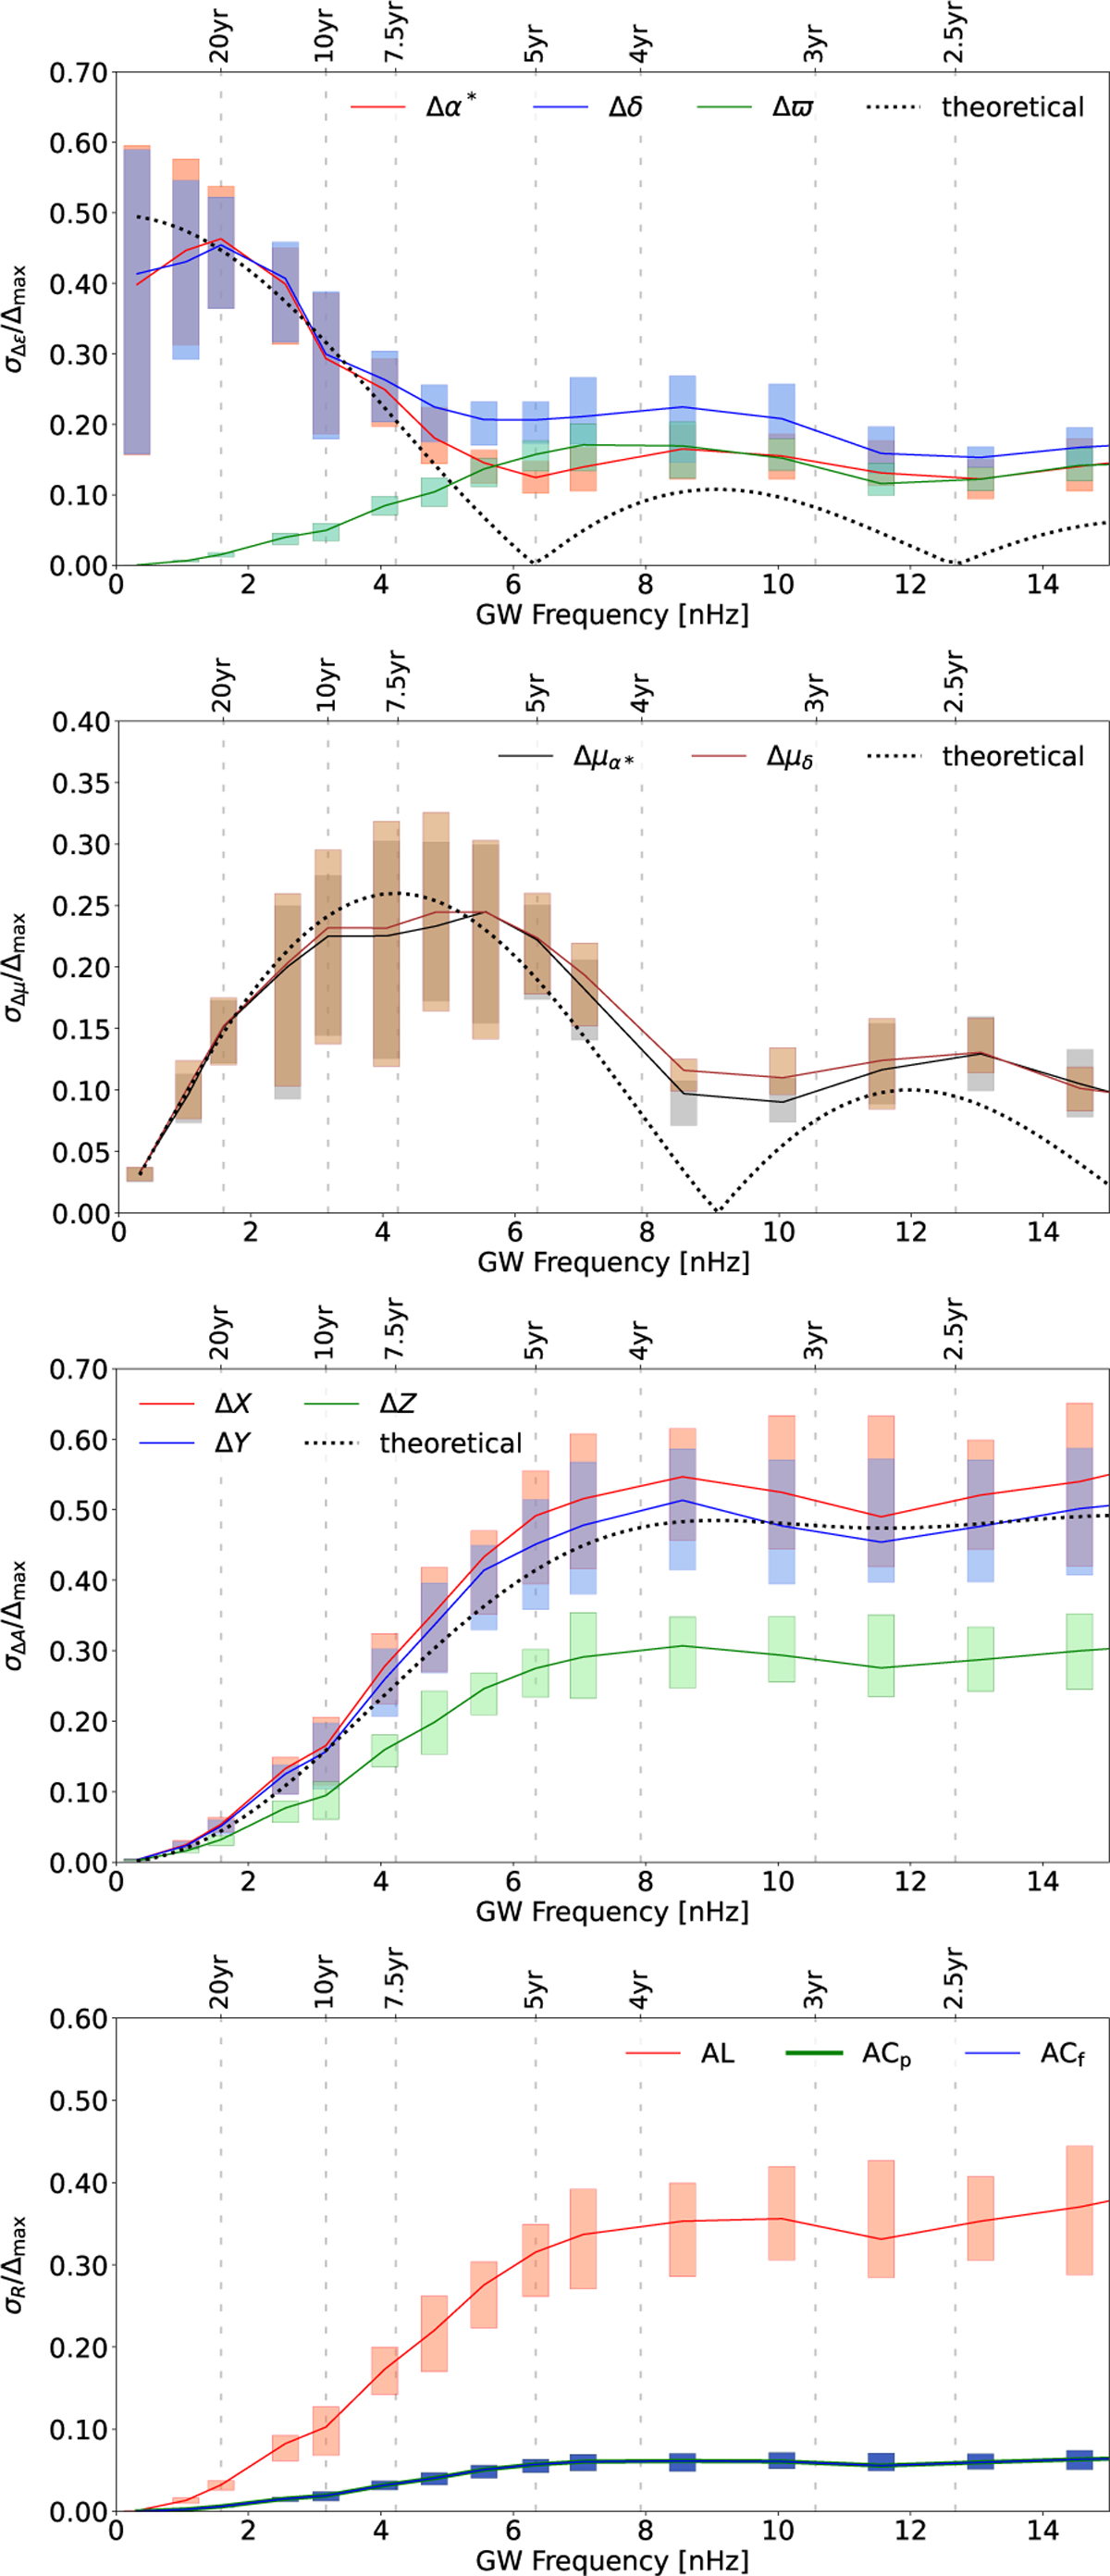
Standard deviations of the errors in source parameters, attitude, and residuals, for GW periods longer than 2.1 yr. These plots are zoomed versions of the ones in Figs. 5–6, but with a few more points added to improve the coverage at the lowest frequencies. Theoretical curves shown on the three upper plots are given by Eqs. (10), (11), and (12), respectively (see text for further explanations).
Current usage metrics show cumulative count of Article Views (full-text article views including HTML views, PDF and ePub downloads, according to the available data) and Abstracts Views on Vision4Press platform.
Data correspond to usage on the plateform after 2015. The current usage metrics is available 48-96 hours after online publication and is updated daily on week days.
Initial download of the metrics may take a while.