Fig. A.1

Download original image
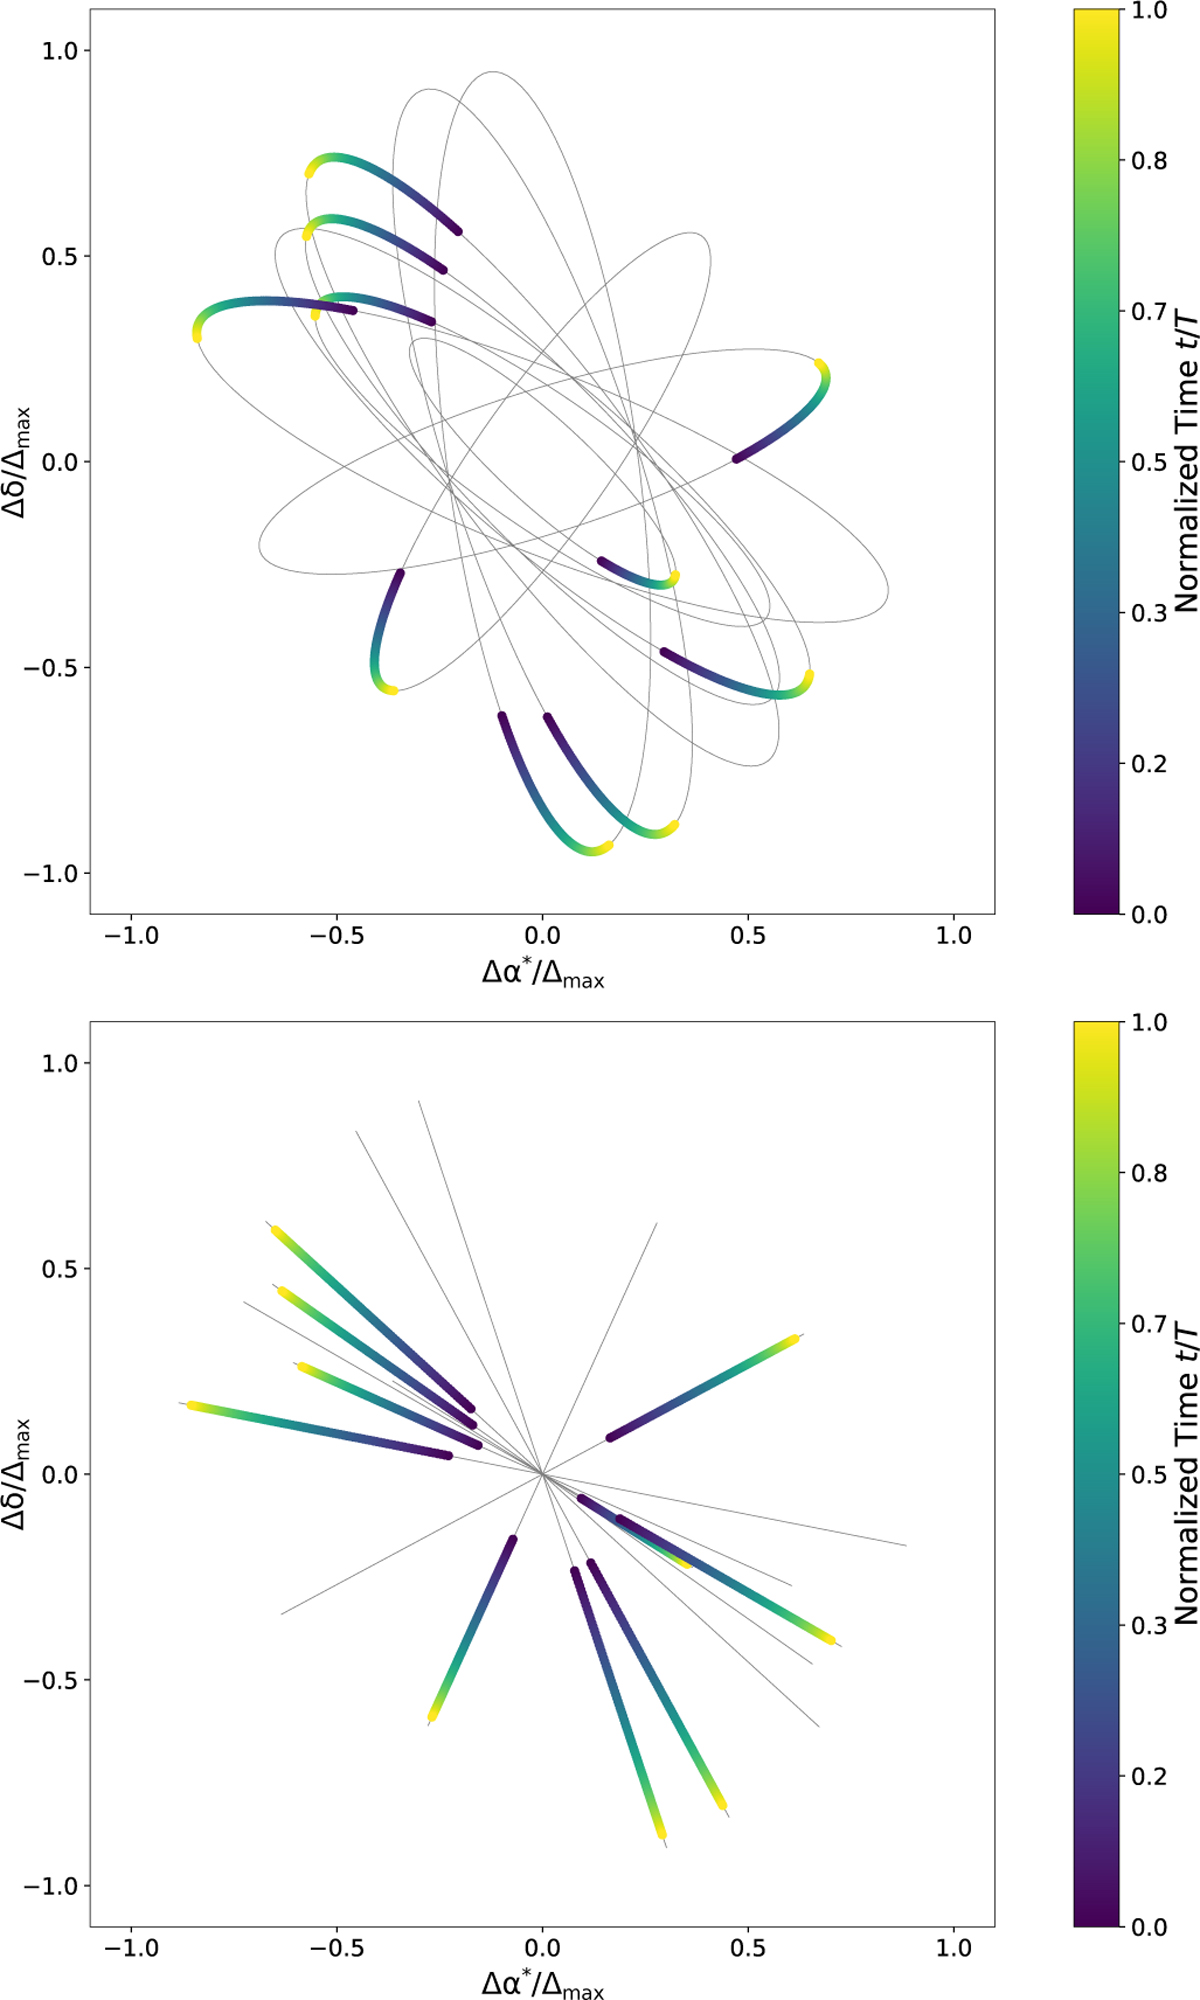
Positional offsets of ten randomly chosen astrometric sources, as produced by two GWs propagating in the same direction and having the same frequency, but with different strain parameters ![]() , and
, and ![]() . Top: for a GW with randomly chosen strain parameters, yielding the (random) axis ratio ≃0.24 (corresponding to e ≃ 0.97). Bottom: for a GW with
. Top: for a GW with randomly chosen strain parameters, yielding the (random) axis ratio ≃0.24 (corresponding to e ≃ 0.97). Bottom: for a GW with ![]() , yielding an axis ratio = 0 (corresponding to e = 1). The offsets are shown in the local tangential coordinates of respective source, normalised by Δmax, and colour-coded by time normalised to the mission duration T. The GW period is Pgw = 6T. The grey lines show the complete path that would be traced for T ≥ Pgw . None of the randomly selected sources is exactly at 90◦ angle from the GW source, so none of the ellipses attains the maximum semimajor axis Δmax . (The Rømer correction was neglected in these plots, but would hardly be visible if it were included.)
, yielding an axis ratio = 0 (corresponding to e = 1). The offsets are shown in the local tangential coordinates of respective source, normalised by Δmax, and colour-coded by time normalised to the mission duration T. The GW period is Pgw = 6T. The grey lines show the complete path that would be traced for T ≥ Pgw . None of the randomly selected sources is exactly at 90◦ angle from the GW source, so none of the ellipses attains the maximum semimajor axis Δmax . (The Rømer correction was neglected in these plots, but would hardly be visible if it were included.)
Current usage metrics show cumulative count of Article Views (full-text article views including HTML views, PDF and ePub downloads, according to the available data) and Abstracts Views on Vision4Press platform.
Data correspond to usage on the plateform after 2015. The current usage metrics is available 48-96 hours after online publication and is updated daily on week days.
Initial download of the metrics may take a while.


