Fig. 1
Download original image
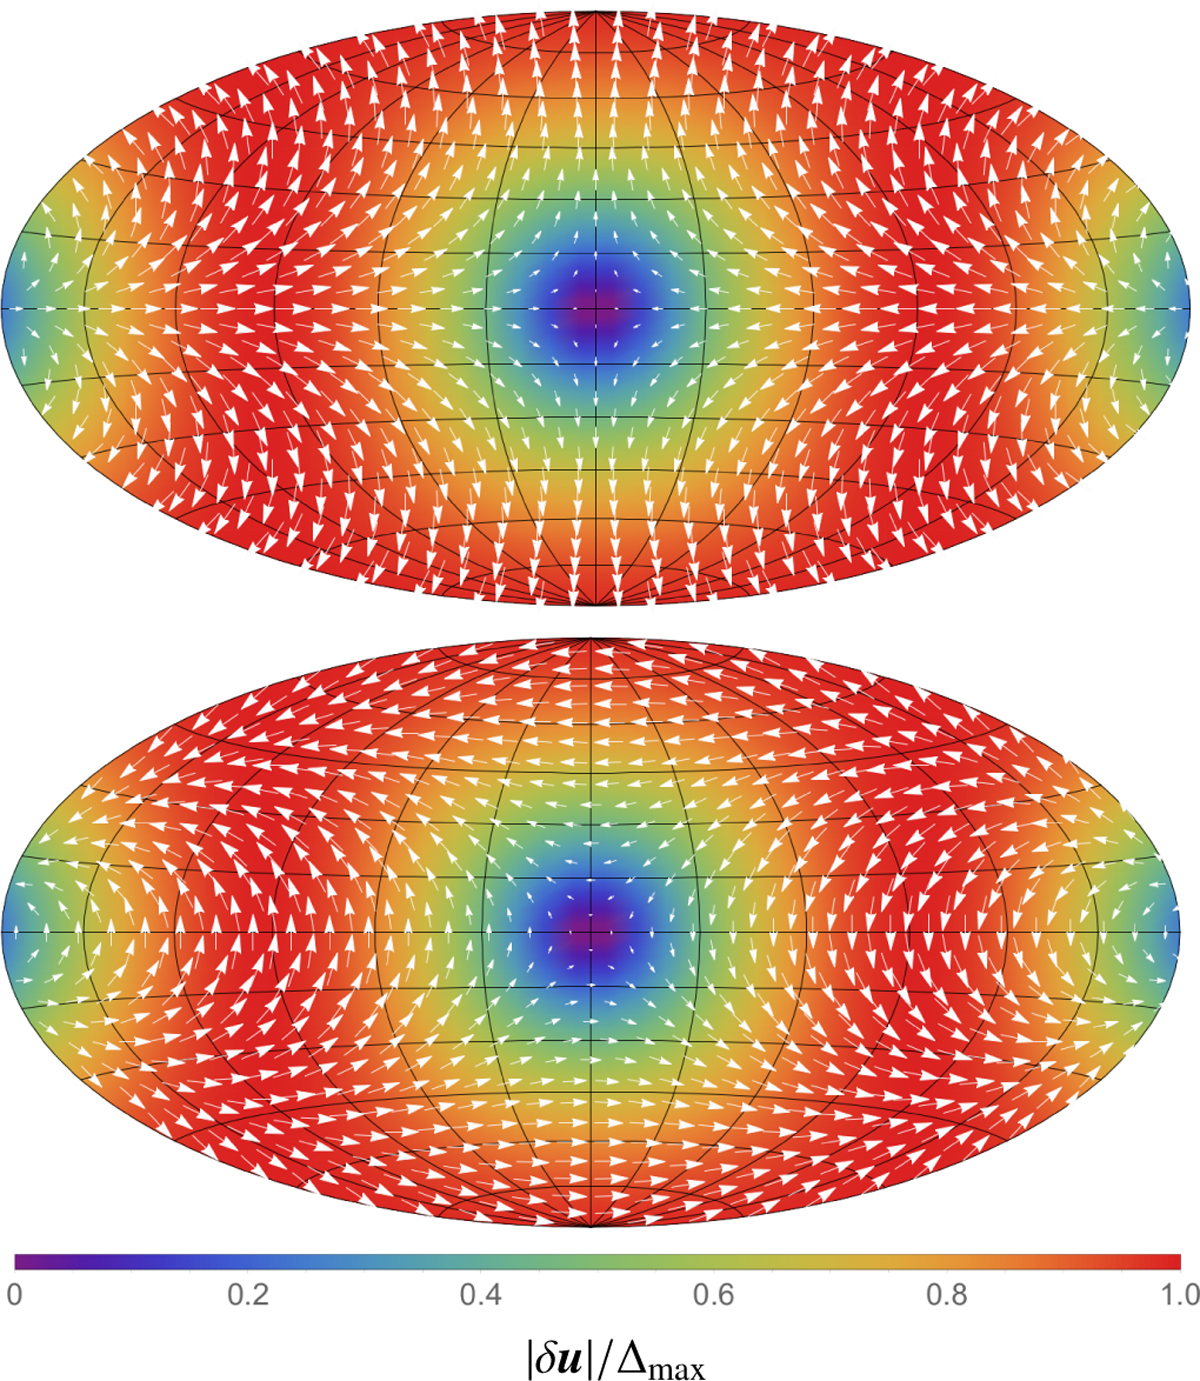
Apparent shifts, δv, in source positions caused by the two polarisation components of a plane GW propagating towards the centre of the maps, i.e. the ‘+’ component (top) and ‘×’ component (bottom). The background colour encodes the magnitude of the shift, |δu |, in units of the maximum shift ∆max. This and all other full-sky maps use the Hammer-Aitoff projection in equatorial coordinates, with α = δ = 0 at the centre, north up, and α increasing from right to left.
Current usage metrics show cumulative count of Article Views (full-text article views including HTML views, PDF and ePub downloads, according to the available data) and Abstracts Views on Vision4Press platform.
Data correspond to usage on the plateform after 2015. The current usage metrics is available 48-96 hours after online publication and is updated daily on week days.
Initial download of the metrics may take a while.