| Issue |
A&A
Volume 695, March 2025
|
|
|---|---|---|
| Article Number | A92 | |
| Number of page(s) | 9 | |
| Section | Galactic structure, stellar clusters and populations | |
| DOI | https://doi.org/10.1051/0004-6361/202453453 | |
| Published online | 11 March 2025 | |
Mass flows in the Galactic Center by supernovae of the circumnuclear disk
1
Physics Institute, University of Szeged,
Dóm tér 9,
Szeged
6723, Hungary
2
Astronomical Institute, Academy of Sciences,
Boční II 1401,
Prague, Czech Republic
3
Department of Physics and Astronomy, University of California,
Los Angeles,
CA
90095-1547, USA
4
LESIA, Observatoire de Paris, Université PSL, CNRS, Sorbonne Université, Université de Paris Cité,
5 place Jules Janssen,
92190
Meudon, France
★ Corresponding author; This email address is being protected from spambots. You need JavaScript enabled to view it.
Received:
15
December
2024
Accepted:
30
January
2025
Abstract
Context. The circumnuclear disk (CND) is presently the main supply of mass for the accretion onto the supermassive black hole (SMBH) in the Galactic Center (GC). While the accretion is relatively slow, it has been suspected that local episodic explosive events play an important role in the temporary mass inflow toward the SMBH, while also affecting the evolution of the CND.
Aims. The aim of this study is to follow the changes in mass flows caused by supernova (SN) explosions nestled in or near the CND.
Methods. We performed simulations with the grid-based magnetohydrodynamic code FLASH of the inner 5 pc of the Milky Way GC, including the gravitational potential, rotation, magnetic field, central wind source, and the warm gas of the CND, all mimicking the observed physical properties.
Results. Assuming a MSN = 10 M⊙ as the mass of the precursor of the core-collapse SN event at various locations within 2 pc from the GC, we detect a temporary increase in the accretion rate, transferring an additional 2–60 M⊙ of warm gas to the immediate vicinity of the SMBH, depending on the explosion site. At the same time, the kinetic energy of the SN even blows away mass from the CND; the additional warm gas leaving the simulation domain after the explosion is on the order of ~100 M⊙. In the studied cases, the impact on mass flows and the turbulence caused by the explosion cease after ~250 kyr.
Key words: ISM: supernova remnants / Galaxy: center / Galaxy: nucleus
© The Authors 2025
 Open Access article, published by EDP Sciences, under the terms of the Creative Commons Attribution License (https://creativecommons.org/licenses/by/4.0), which permits unrestricted use, distribution, and reproduction in any medium, provided the original work is properly cited.
This article is published in open access under the Subscribe to Open model. This email address is being protected from spambots. You need JavaScript enabled to view it. to support open access publication.
1 Introduction
The innermost few parsecs of the Galactic Center (GC) are occupied by a structure that formed by dense molecular gas, called the circumnuclear disk (CND). Our knowledge about the properties of the CND has been considerably enhanced by observations with the Atacama Large Millimeter Array (ALMA) and the Stratospheric Observatory for Infrared Astronomy (SOFIA). The size and form of the CND – or, the circumnuclear ring (CNR), which is the inner edge of the disk – vary in the literature, with a typical inner radius of 1.5–2 pc. The outer radius is less well defined because of the lower densities with a continuous transition into the rarified environment. Here, the motion of the molecular gas within 1 pc is dominated by the gravitational potential of the SMBH and further away it follows a Keplerian rotation in the gravitational field of the supermassive black hole (SMBH) and of the nuclear star cluster (NSC).
With an estimated mass of a few tens of thousands of M⊙, the CND has a significant impact on the mass transfers and structural evolution near the GC. Observations show that the disk surrounds the so-called mini-spiral consisting of gas streams that transport relatively dense gas to the close vicinity of Sgr A*, and consequently that contribute to the growth of the SMBH. The disk itself is not homogeneous, but is populated with clumps and filaments. The group of local massive stars, also called the young nuclear cluster (YNC), nestled in the NSC within 0.5 pc of Sgr A*, issues strong stellar winds that exert a powerful impact on the local environment. This wind ablates or drags the low- density outer parts of the CND and carries mass to high Galactic latitudes, producing outflows from the galactic disk. These processes are enhanced by the rapid outburst of kinetic energy caused by supernovae (SNe).
The formation mechanism and long-term evolution of the CND have not been understood yet. Some argue that the CND is a transient structure (e.g., Güsten et al. 1987; Requena-Torres et al. 2012). Such hypotheses generally claim that an infalling gas cloud encountered the SMBH and was circularized by tidal forces that left it in its configuration as a disk (Sanders 1998; Bradford et al. 2005; Bonnell & Rice 2008; Wardle & Yusef-Zadeh 2008; Hobbs & Nayakshin 2009; Alig et al. 2011; Oka et al. 2011; Mapelli et al. 2012; Mapelli & Trani 2016; Goicoechea et al. 2018; Trani et al. 2018; Ballone et al. 2019). The nonuniformity is supposed to be smoothed out by differential rotation in a couple of dynamical timescales (i.e., a few hundred thousand years). Similarly, Güsten et al. (1987) showed that the observed dense clumps in the disk are tidally unstable with a lifetime of ~ 105 yr, so they argued that they would exist only in a young, transient disk. On the other hand, it was pointed out that clumps might only be artifacts caused by observational limitations (Dinh et al. 2021). Violent episodic events, such as SNe arising from inside or near the CND, could create transient structures. The estimated SN rate for the far larger and more massive central molecular zone (MCMZ = 3 − 6 × 10⁷ M⊙) is ~2− 5 × 10⁻⁴ yr−1 (Dahmen et al. 1998; Crocker et al. 2011). At the same time, the SN rate for the three orders of magnitude less massive CND is not well constrained. However, proportionally more SN remnants can occur in the vicinity of the CND because of the strongly peaked stellar density and the estimated top-heavy initial mass function in the YNC (Lu et al. 2013). The high number of SN Ia precursors inferred from X-ray surveys indicates that such SN explosions are also common there. Considering both of these contributions, we can assume that the SN rate should be particularly high in the vicinity of the GC. We estimate that the average time between SNe occurring in or near the CND is comparable with, or even shorter than, the dynamical timescale of the disk (tdyn ≃ 100 kyr), thus providing a continuous impact on its evolution by stellar explosions.
The evolution and longevity of the CND have been subjects of numerous hydrodynamic modeling efforts. Coker et al. (2003) used the finite-difference Eulerian ZEUS3D code (Clarke 1996) to study the formation of the CND by simulating the infall of single giant and multiple smaller molecular clouds. A similar simulation was performed by Mapelli & Trani (2016) by using the GASOLINE N-body smoothed particle hydrodynamic (SPH) code. Dinh et al. (2021) performed a set of 3D SPH simulations, each including the external and the self-gravity, artificial viscosity, and varying turbulence. A greater volume, the innermost 20 × 20 × 10 pc of the GC, was modeled by Blank et al. (2016) with the adaptive mesh-refinement magnetohydrodynamic (AMR MHD) code AstroBEAR (Cunningham et al. 2009) through several dynamical times; their work showed the impact of the magnetic field on the inward migration of mass. Solanki et al. (2023) used Athena++ (Stone et al. 2020), a grid-based MHD code, to simulate the interaction between the central wind and the inner edge of the CND, causing accretion to smaller radii.
Despite the importance of high-energy shocks in the dense CND environment, individual SNe have not been included in similar hydrodynamic simulations. In this current study, we aim to follow the long-term evolution of an accreting disk representing the CND of the Milky Way GC. For this study, we improved the model by adding occasional SN explosions to the dynamical investigation of the CND. This extension was motivated by the presence of the YNC, which hosts core-collapse SNe at a higher rate than the dynamical timescale of the CND, and because SN Ia might be abundantly occurring in this high-stellar-density region. By following the evolution of the SN remnant, we investigated the impact of its kinetic energy on the mass flow toward the GC, thereby constraining the ultimate accretion onto the SMBH and the rate at which gas is ejected from the CND.
This paper is organized as follows. In Section 2, we describe the observed physical properties of the CND, and how our model setup reproduces these features. In Section 3, we show and interpret the evolution of our fiducial model when a SN is added to the setup, and compare the model results to the observational features. We summarize our conclusions in Section 4.
2 Simulation of the circumnuclear disk
2.1 Observed CND properties
The model disk, similarly to the gravitational potential and stellar wind source described in Sect. 2.2, is assumed to mimic the mass distribution in the center of the Milky Way. Observations show a sharp inner edge of the disk at rGC = 1.5 pc (Christopher et al. 2005) and a less distinct outer radius with rGC = 3–7 pc (Hsieh et al. 2021). The thickness of the disk linearly increases from 0.4 (Jackson et al. 1993) to 2 pc (depending on the exact location of the outer edge; Vollmer & Duschl 2001), respectively.
The temperature of the disk close to the rotational plane is in the range of 200–500 K (Requena-Torres et al. 2012; Mills et al. 2013), which is too low to maintain the observed CND thickness alone via thermal pressure.
Another important component is the magnetic field, whose strength is in the order of B ≃ 1–10 × 10−3 G as it was shown by observation of Zeeman splitting (Plante et al. 1995), MHD shocks (Bradford et al. 2005) and the polarization of dust particles (e.g., Hildebrand et al. 1993; Guerra et al. 2023; Akshaya & Hoang 2024). The impact of the B field can be described by the plasma beta parameter, which is the ratio of thermal-to-magnetic pressure components,
 (1)
(1)
where n and T are the number density and the temperature of the gas, respectively, while k is the Boltzmann-factor. The observations provide a value of β ≃ 0.001, however, the kinetic pressure arising from the presence of strong turbulence probably exceeds the thermal pressure. Studies based on the observed velocity dispersion give estimates between 0.03 (Mills et al. 2017) and 0.7 (Hsieh et al. 2021) for β′, which also incorporates the impact of turbulence-associated pressure on the magnetic pressure. Either way, the modeling attempts of the CND cannot fully describe its evolution without the inclusion of MHD effects.
The observations also suggest that the disk is not uniform, instead, it shows a clumpy morphology (e.g., Vollmer & Duschl 2001; Montero-Castaño et al. 2009; Hsieh et al. 2021). The fragments could be significant indicators of the age of the CND depending on whether these features are dense enough to be tidally stable, and thus, possibly exist on several dynamical timescales. Other substructures within the CND are the ionized gas streams located in the inner cavity transporting matter closer to the GC (namely the northern and eastern streams, constituting two of the three arms forming the so-called Mini-Spiral). Due to the angular momentum loss of the gas flow, which is potentially enhanced by collisions of the streams and by self-collision and concomitant circularization, some matter is captured by the accretion disk of the Sgr A* and contributes to the growth of the SMBH (Liszt 2003; Paumard et al. 2004; Zhao et al. 2009). The inner cavity is partially maintained by the strong magnetic field. Blank et al. (2016) found that the assumed milligauss azimuthal field stabilizes the inner disk rim against rapid inward migration of mass caused by the instabilities due to the interaction of the wind with the inner edge of the disk.
2.2 Grid-based model of the CND
In this study, we used the 3D adaptive mesh-refinement code FLASH (Fryxell et al. 2000) for modeling the CND over several dynamical times, tdyn ≃ 150 kyr. Since the aim of this study is the long-term follow-up of CND evolution, the environment (i.e., gravitational potential, stellar wind, ambient medium properties) was designed to be stationary over multiple dynamical times of the CND. We note that most of the numerical descriptions handle the CND independently from the medium around the disk. Moreover, considering the inaccuracies inherent to grid-based simulation (e.g., numerical viscosity, insufficient resolution), the modeled CND slightly deviates from the theoretical descriptions. As a result, the disk properties, will, after an initial oscillatory phase, relax into a quasi-equilibrium state, similar to the initial design.
The initial structure of the CND (the cross-section can be seen in Fig. 1) follows hydrostatic equilibrium governed by the ratio of the rotation speed of the disk to the sound speed (magnetic pressure is not accounted for yet). In the isothermal disk, if no other source of pressure is introduced, the gas pressure would provide a Gaussian profile for the initial vertical density distribution (i.e., along the z-axis), with a scale height of H = c/Ω, where c is the sound speed and Ω is the angular orbital speed in the CND. We assume a constant density ρ0 in the x-y rotational plane (z = 0), between the inner (Rmin) and outer edge (Rmax) of the CND.
Initially, the torus covers the range from Rmin = 1.0 to Rmax = 2.5 pc with a density in the rotational plane of ρ0 = 5 × 10⁻¹⁹ g cm−3. The sound speed, and thus the scale height, is prescribed only by the TCND temperature of the disk. During the simulation, the interior of the CND is dense enough to effectively cool, following the prescription of Schure et al. (2009) and assuming solar metallicity. However, in such a case, TCND would drop below ~100 K and our resolution would not allow us to properly simulate such high density regions. This would lead to the collapse of the disk into a thin layer, which does not correspond to observations. To avoid this, we introduce a floor value, which artificially prevents the temperature from dropping below TCND = 1000 K. This is assumed to partially cover the effect of microturbulence, which is mainly responsible for the pressure support, but not included in our setup due to the insufficient resolution (see Solanki et al. 2023 for a similar approach). We note that our setup also includes a magnetic field which also contributes to the MHD equilibrium of the disk via turbulence and magnetic pressure.
The mass of the initial setup amounts to MCND = 22000 M⊙, which matches with the estimated mass of the CND. Initially, although the magnetic pressure is accounted for, the outer regions of the disk expand because the initial setup was not in MHD equilibrium (see below). As a result, the density drops to ~10−20 g cm−3 in the rotation plane, and the outer, low- density, thicker extensions of the disk (at a greater galactocentric distance, rGC > 3 pc) start oscillating with decreasing amplitude. The total CND mass rapidly decreases mainly due to the wind, which sweeps away ~1600 M⊙ from the lower-density outer lobes of the disk during the first 100 kyr. After the relaxation of the simulation, the warm gas of the disk dragged by the wind integrates into the outflow resulting in a mass-loaded wind with higher density than the initially inserted wind source. At t = 250 kyr (the moment of the imposed SN explosion), the steady escape rate of mass from the computational domain is ~0.45 M⊙/kyr, which corresponds to a mass loading factor of 3 in the escaping wind.
The adopted gravitational potential follows the description of Chatzopoulos et al. (2015), assuming a point-like SMBH and two-component NSCs,
 (2)
(2)
where a1 = 3.9 pc, γ1 = 0.51 and a2 = 94.4 pc, γ2 = 0.07 are the characteristic sizes and the density slopes of the two components of the NSCs, respectively (similarly to the previous hydrodynamic simulations of the GC, e.g., Palouš et al. 2020; Barna et al. 2022).
In a realistic disk, the rotational velocity deviates slightly from the function (v0) estimated from Eq. (2) due to the radial pressure gradient. This difference is second order in c/v0, which, considering the disk temperature of TCND = 1000 K, is ~2−3 km s−1, depending on the radial coordinate. Since early oscillation of the disk properties, including the velocity profile, are higher due to the interaction with the ambient medium than the effect of the velocity adjustment, we neglect the deviation from the initial v0.
This initial rotational velocity field is valid only within 0.1 < rGC < 5 pc. At the very center within rGC = 0.1 pc, the gravitational potential is set to be constant to avoid very high velocities. Beyond rGC = 5 pc, at the beginning of the simulation, a static outermost region is defined, where both the gravitational potential and the initial rotation velocity are set to zero. This method is required to avoid the formation of voids at the corners of the simulation volume due to the rotation. The diode option, allowing only one-way outflows, is introduced as the boundary condition for the setup. As a result, the matter reaching rGC = 5 pc can leave the domain without any obstacles, thus preventing unpredictable inflow into the simulation domain in the X- and Y-directions. This treatment of the outermost region has no impact on the mass flows within the CND. Material that reaches this outer region from the wind source or the CND may flow out and leave the simulation domain.
The velocity cross-section of the simulation domain deviates from the initial function in the mid-plane and slows down with time due to the boundary interactions and the oscillating expansion of the disk. The deviations from Keplerian velocities appear mainly within rGC < 0.5 pc, where the sink captures the inwardmoving mass with its momentum (see in Sect. 2.4). Outside of rGC > 3 pc, the low-density extension of the disk are affected by the outward moving flows. At the same time, the great majority of the CND maintains the initial velocity profile, and its structure (cf., Fig. 2).
The resolution of the model is constrained by needing to reproduce the main components of the mass flows, but, at the same time, to keep the simulation runs manageable with computational resources of ~1000 CPU. Therefore, the resolution of the 10 × 10 × 10 pc simulation domain is set according to the steady-state accretion rate of the CND model, which matches the estimated mass inflow rate of the GC (for a more detailed description see Sect. 3.1).
As an indicator for the stability of our model, we check that the disk keeps its integrity and maintains a Gaussian density profile along the z-axis, and that it deviates only slightly from axial symmetry at large R (see in Figs. 3 and 4). Additionally, we check that, the vrot (R) rotational curve keeps its initial function over multiple dynamical timescales outside the rGC = 0.1 pc zone (Fig. 2). Discrepancies with these conditions emerge only in the outermost regions (R > 3 pc) where the low-density outer extensions of the disk expand and radially oscillate due to the impact of stellar wind and the temporary lack of MHD equilibrium.
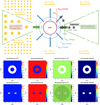 |
Fig. 1 Initial properties of the CND in our model setup at T=0, with the disk shown in the cross section at the top, followed by face-on plots and cross-sectional plots of the initial values of physical parameters. The grid in the pressure plot (bottom line) represents the refinement of the simulation domain. |
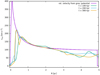 |
Fig. 2 Evolution of rotational velocities in the rotational plane (at z = 0). |
2.3 Magnetic field
Polarization vectors indicate that the B field lines have a dominantly azimuthal orientation (Werner et al. 1988) on a large scale, since the magnetic field follows the differentially rotating gas around the GC (Wardle & Konigl 1990). Guerra et al. (2023) showed that magnetic pressure is orders of magnitude stronger than gas pressure, thus, former options are more likely. Here we assume a strong magnetic field as the main contributor maintaining the CND thickness perpendicular to the rotational plane, and it evolves until it reaches MHD equilibrium.
At the beginning of the simulation, a purely azimuthal magnetic field is introduced. It follows the rotation of the gas and has an initial value of Binit = 3 × 10⁻³ G in the CND. For the environment, Binit is scaled with the density because of the strong coupling between matter and magnetic B field in the MHD solver. The minor inconsistencies of the initial setup, such as the jump in the B field at the surface of the CND, quickly vanish because of the movement of the matter, which is coupled to the magnetic field lines. Similarly to hydrodynamical properties, the magnetic field also relaxes with time (Figs. 3 and 4). Weak Bz component (that which is perpendicular to the rotational plane) emerges following the expansion of the disk, but remains two orders of magnitude smaller than the other components. The central wind source is inserted without any magnetic field component on the grid, in accordance with the random orientation of stars of the NSC.
By the moment of the SN explosion, the simulation has reached MHD equilibrium. In the rotational plane, B varies between 0.0005 and 0.001 G, which matches well the polarization measurements of the Galactic Center. The field weakens outward with the decreasing density and it is negligible in the medium around the CND. The approximate value of β, which also accounts for the turbulent pressure in the CND (see in Sect. 2.2), is in the range of 0.1–0.5, meaning that magnetic pressure plays an important role in the formation of structures in the disk. To capture this kind of evolution, relatively long simulations are needed, at least a few times the dynamical timescale (tdyn ≃ 150 kyr). In the simulation with magnetic field, stellar wind is confined by the magnetic pressure, since the local value of β in the wind is an order of magnitude lower than that of the CND.
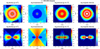 |
Fig. 4 Relaxed CND properties after t = 500 kyr in the fiducial simulation. |
2.4 Central region: Sink and wind source
The accreted mass from the CND can reach the central 0.5 pc, where the complex structures and mass flows (namely ionized gas streams, WR winds, the accretion flow, orbiting compact clouds, outflow from the inner accretion flow) are not resolved in our simulations. Here, a large fraction of the gas pulled or driven into the gravitational well reaches the close vicinity of the SMBH from where it may join the accretion flow. This process is modeled by a central sink with a radius of rsink = 0.3 pc, corresponding to the region where the gravitational potential of the SMBH dominates over other processes considered in our MHD simulation. The simulation eliminates mass that moves within rsink, as well as its corresponding momentum, if its density surpasses the threshold value of nsink = 500 cm−3, assuming that that mass has inexorably joined the accretion flow. We note that the value nsink affects only the time at which the mass accumulation at the center reaches a quasi-steady rate, and thus, it can be replaced by other number densities. The chosen threshold of nsink = 500 cm−3 provides measurable accumulation in the accretion disk within ~50 kyr, which is significantly shorter period than tdyn.
We also assume a spherically symmetric central wind originating from the young population of the NSC with the mean radius of 0.5 pc. We model the impact of the ~ 100 massive stars known to populate the YNC (Lu 2018). The same treatment is adopted as that in the study of Ehlerová et al. (2022), assuming a wind luminosity L = 3 × 1038 erg s−1 and a wind terminal velocity of vinf = 2500 km s−1. These provide a mass injection rate of  M⊙ yr−1 as the basis of the central wind.
The density of the wind source, nw, is a function of the radial coordinate rGC in the form,
![Mathematical equation: ${n_{\rm{w}}}\left( {{r_{{\rm{GC}}}}} \right) = {{{n_{{\rm{w}}0}}} \over {{{\left[ {1 + {{\left( {{{{r_{{\rm{GC}}}}} \over {{r_{{\rm{w}}0}}}}} \right)}^2}} \right]}^\beta }}},$](/articles/aa/full_html/2025/03/aa53453-24/aa53453-24-eq4.png) (3)
(3)
where volume density nw(rGC) is specified with the following fitting parameters: n0,w = 1 cm−3, β = 1.5, rw0 = 0.3 pc.
Some fraction of the inflow from the CND may be dragged outward by the central wind. We note that the current set of simulations does not assume central mass loading and the inserted wind source accounts only for the core of the YNC. However, the wind may be mass-loaded outside of the rwind region, where the additional mass may originate from either the surface or the inner edge of the CND, from where the gas is exposed to, and ablated by, the wind.
In summary, the simulation of the gas flow is subjected to the following steps near the GC:
The matter is advected by the Hydro (built-in PPM solver) module of Flash;
The accreted CND gas reaching the distance rGC < rsink = 0.3 pc is consumed by a sink, if the number density of any cells exceeds density threshold nsink = 500 cm–3. If the gas of a cell within rsink is less than this threshold, the accreted material further accumulates until the density reaches nsink;
The stellar wind (initially free of any mass-loading) is injected within rw0 = 0.5 pc with a density given by equation (3).
Since the wind density never exceeds nsink, the implementation of the sink within the central wind source does not decrease the mass of the outflowing hot gas. For those cells in which the accretion penetrates to the sink and in which the local density exceeds the nsink limit within rw0), the loss of wind material is negligible.
2.5 Supernova explosions
For the SN simulations, we consistently choose t = 250 kyr as the moment of the explosion (the actual status of the disk at this moment can be seen in Fig. 3). Since the Galactic Center is known to host many massive young stars, so that the Type la SN rate is significantly lower than that of Type II, we assume that the SN is a typical Type II event with ejecta mass of MSN = 10 M⊙. The canonical kinetic energy of ESN = 1051 erg is inserted into the selected region of the grid, in the form of MSN of hot gas (although the internal energy is negligible compared to ESN), modeling the main properties of a typical young core collapse event at the end of the free expansion phase. The ESN and MSN are inserted on 2 × 2 × 2 cells at various explosion sites in the disk to investigate the impact of the SN locations. The SN is expected to affect the dynamics of the CND on a larger scale. Since the kinetic energy is the only attribute of the SN which is comparable to that of the CND, we neglect any other physical properties of the ejecta (e.g., magnetic field, turbulence).
3 Results
3.1 Steady-state accretion
The disk reaches MHD quasi-equilibrium in a dynamical timescale (tdyn ≃ 150 kyr), when the oscillation of physical properties relaxes and both the accretion rate and the rate of mass leaving the domain become constant. Later, the disk keeps its integrity in the reference simulation over at least several dynamical timescales. In this reference model, the accretion of the CND is the result of numerical viscosity, thus, it is a function of the spatial resolution of the simulation, and of the instabilities due to interaction between stellar winds and CND mass at its inner edge.
We note that the model accretion is caused by the numerical viscosity which is controlled by the resolution of the simulation. We aim to perform the simulation with the lowest refinement level which is able to reproduce the accretion rate of the observed CND. For comparison, we follow the description of an α- accreting disk (Shakura & Sunyaev 1973) to provide quantitative estimates about the accretion in the CND,
 (4)
(4)
where ∑(R, t) is the surface density, and vr is the inward radial flow velocity of the disk.
The Ṁ is directly measured by the mass accreted by the central sink. Our simulation setup allows us to register the properties of the mass destroyed by the central sink and to distinguish between the mass originating from the CND and the infalling gas from outside of the CND. The contribution of the latter source is less than 1%, thus, the mass inflow is almost exclusively accreted from the disk.
The fiducial model of the CND indicates a mass inflow rate of Ṁacc = 1.2 × 10⁻⁴ M⊙ yr−1 over a dynamical timescale, with a constant rate. This value is greater than the Bondi accretion rates estimated for Sgr A*, ranging from 3 × 10⁻⁵ to 2 × 10⁻⁴ M⊙ (see e.g., Quataert et al. 1999; Melia 1992, respectively), and also exceeds the rate estimated from the observations of the Event Horizon Telescope by orders of magnitude. The difference between observation and the simulation can be interpreted as the majority of accreted mass from the CND gets blown away by the wind from the YNC. Thus, the mass inflow estimated in this study does not represent the direct accretion onto the SMBH, instead the rate at which the matter enters the accretion flow.
The efficiency of the α-accreting disk is often described by the α dimensionless scale factor of viscosity,
 (5)
(5)
where cS is the local mean (or average over a range of R) sound speed, H is the scale height of the disk. The kinematic viscosity, v can be estimated as:
![Mathematical equation: $v \times {\rm{\Sigma }} = {{\dot M} \over {3\pi }}\left[ {1 - {{\left( {{R_*}/R} \right)}^{1/2}}} \right],$](/articles/aa/full_html/2025/03/aa53453-24/aa53453-24-eq7.png) (6)
(6)
where R* is inner edge of the accretion disk.
The approximate value of α is expected to be ~0.1 for a thin disk around a SMBH. It can be expected that α would decrease by increasing the resolution of our model disk, providing a quantitative estimate of the numerical viscosity and a floor value for spatial resolution. In the case of refinement level 6 (∆x = 1.25 × 1017 cm), α varies between 0.01 and 0.5 depending on the radial coordinate. The external environment of the disk, chosen as outside of rGC = 4 pc, is resolved with refinement level of 5 (∆x = 2.5 × 1017 cm).
As the simulations show (see in Fig. 6), the accretion flow in the rotational plane can overcome the ram pressure caused by the wind and reach rsink. Outside of z = 0 (i.e., the rotational plane resolved in two cells width in our simulation), the weaker inward flow of the disk is suppressed by the wind, and no accretion is expected until the addition of shock waves caused by SNe.
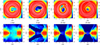 |
Fig. 5 Evolution of the SN remnant with an explosion site at rGC = 1 pc in the midplane of the CND (model SN_r10_i00). |
Summary of initial SN properties.
3.2 Impact of supernova explosions
We follow the evolution of the CND in seven scenarios assuming a SN with the same energy exploding at different sites (see in Table 1). For reference, we also evolve the fiducial model setup without any SN event and compare the mass loss history of the disk.
The SN properties (described in Sect. 2.5 added to the grid at t = 250 kyr quickly produce a shell in the dense environment and after a few tens of kiloyears of evolution, it disperses in the dense CND (an example of the SN shell evolution can be seen in Fig. 5). Meanwhile, the shock front can reach both the central sink, producing an increment in the accretion, and the low-density outer environment, where the shell quickly leaves the boundaries of the simulation domain. The turbulence caused by the SN also has a long-term effect on the mass transport within the CND.
The changes in the total mass of the simulation domain can be described as:
 (7)
(7)
where the stellar wind mass, Mwind, is assumed to be constant in time. We follow the Macc accreted mass, which falls into the central sink (see in Sect. 2.4), and the Mesc mass leaving the simulation domain to characterize the impact of the SN on the CND. The simulations run until both functions reach the same slope as those of the reference model, that is, the point at which no further impact of the explosion can be detected.
The example of the SN_r10_i00 run (for the explanation of the nomenclature, see Table 1), including the first 250 kyr of MHD relaxation phase and the impact of the SN explosion, is shown in Fig. 6 compared to the reference model. The extra accretion caused by the inserted kinetic energy of the SN results from the combination of two processes. Right after the explosion, the shock pushes the gas between the center and the explosion site toward the sink causing a rapid growth in accretion at ~50 kyr after an explosion. Later, the shock spreading in the disk triggers turbulence, which leads to a loss of angular momentum of some of the gas, and therefore increased accretion. This latter process is relatively slow and is responsible for less than ~25% of the extra accretion in SN_r10_i00.
The greatest mass inflow is caused by explosions occurring close to the rotational plane at rGC ≃ 1 pc (see in Figs. 7 and 9). For SNe at closer galactocentric distances (i.e., within the central cavity of the CND), the shock cannot affect the greater part of the disk during its propagation inward, while the kinetic energy of the outer explosions (rGC ≥ 1.5 pc) quickly dissipates in the densest region of the disk.
The gas leaving the surface of the CND due to kinetic energy insertion quickly expands and leaves the simulation domain. This process is also supported by the central wind which becomes heavily mass-loaded for a brief period (with a factor of ~10 instead of 3, see Sect. 2.4). The modeling setup does not allow further following of the blown-out material, but considering that the radial velocity of the SN shock is approximately a few thousand km s−1, it is likely that the gas can reach high galactic latitudes. The blown-out gas originates mainly from the region having rGC similar to that of the explosion site. The kinetic energy of the SN can effectively sweep out the matter from the lower-density regions of the CND, thus, the relative differences in the cumulative mass of gas escaping the simulation domain are lower compared to those of the accreted material. Depending on the exact explosion site, 50–100 M⊙ leave the vicinity of the CND over 200 kyr (see Fig. 8), after which the growth of the escaping mass stops compared to that of the reference simulation, that is, the outflow rate returns to normal. Even the most extreme case disturbs ~0.3% of the total mass of the disk. Considering a rough estimate of the SN rate in the studied region of the CND and the continuous mass supply from the inflows of the Central Molecular Zone, the disk will likely remain intact on longer timescales.
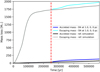 |
Fig. 6 Cumulative mass accretion from the simulation domain with a SN explosion at t = 250 kyr (the dashed red line indicates this moment). Until the CND relaxes and reaches the MHD-equilibrium (at ~200 kyr), nearly 1700 M⊙ of gas leaves the simulation domain. At the moment of the explosion, the accretion onto the central sink and the escaping mass (in the form of a mass-loaded wind) reach an approximately constant phase. The SN explosion causes an increased rate for both mass flows. |
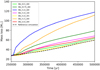 |
Fig. 7 Cumulative accretion into the central sink of CND material after SN events at different explosion sites. |
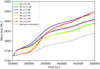 |
Fig. 8 Cumulative mass of gas leaving the simulation domain after SN events at different explosion sites. |
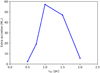 |
Fig. 9 Additional mass inflow caused by SNe occurring in the rotational plane as a function of the galactocentric distance of the explosion site. The accretion is estimated 200 kyr after the explosion (t = 450 kyr) by subtracting the accretion of the fiducial model. |
4 Conclusions
We have conducted 3D MHD simulations of the long-term evolution of the Galactic CND and have evaluated the impact of SNe exploding within it or in its vicinity. The simulations consist of the initially warm CND with mass MCND = 22 000 M⊙ in a torus-like disk and the wind of ~100 massive stars of the young nuclear star cluster. Apart from magneto-hydrodynamics, the simulations take into account the gravitational potential of the SMBH and the NSC, and radiative cooling of the gas. After the simulation reaches MHD quasi-equilibrium, we test the impact of SN explosions at various locations in the CND:
The shock wave of the SN transports significantly more mass out of the disk than the original ejecta mass, over less than a dynamical timescale. The blown-away gas is faster than the escape velocity at the edge of the simulation domain, thus it is likely to reach high Galactic latitudes. The amount of escaping mass per SN explosion is between ~50 M⊙ (for explosion sites closer to the edge of the disk) and ~100 M⊙(for explosion sites in the rotational plane);
After the SN explosion, all simulations showed additional mass inflow to the central sink compared to the steady-state accretion of the fiducial model without any SNe. The additional mass transport is between 2 and 60 M⊙ depending on the location of the explosion site. The greatest impacts on the accretion rate are caused by SNe exploding in the rotational plane at distances of 1–1.5 pc from the GC;
Although the estimated mass inflows triggered by the SN explosions are significantly lower than those of simulations assuming a homogeneous ambient (Palouš et al. 2020; Barna et al. 2022), our models demonstrate that gas swept up by SN shocks can overcome the ram pressure of the central wind source and provoke increased accretion toward the close vicinity of Sgr A*. We note that our simulations cover only a handful of selected explosion sites, but a larger sample of SN locations and a more established SN rate an estimate of the frequency of enhanced accretion events, as well as the enhanced mass loss rate during those events.
This analysis is restricted to the GC of the Milky Way as the specific properties of the environment (e.g., gravitational potential, central wind, mass of the CND) have strong impacts on the outcome of the simulation. Modeling the centers of other galaxies, which will be the subject of future studies, is necessary to understand the contributions of SNe to the growth rates and activities of SMBHs elsewhere.
Acknowledgements
BB received support from the Hungarian National Research, Development and Innovation Office grants OTKA PD-147091. R.W., J.P., and S.E. acknowledge support by the project RVO:67985815. P. V. was supported by French government through the National Research Agency (ANR) with funding grant ANR AGN_MELBa (ANR-21-CE31-0011). We acknowledge the Digital Government Development and Project Management Ltd. for awarding us access to the Komondor HPC facility based in Hungary.
References
- Akshaya, M. S., & Hoang, T. 2024, MNRAS, 531, 5012 [NASA ADS] [CrossRef] [Google Scholar]
- Alig, C., Burkert, A., Johansson, P. H., & Schartmann, M. 2011, MNRAS, 412, 469 [NASA ADS] [CrossRef] [Google Scholar]
- Ballone, A., Mapelli, M., & Trani, A. A. 2019, MNRAS, 488, 5802 [NASA ADS] [CrossRef] [Google Scholar]
- Barna, B., Palouš, J., Ehlerová, S., et al. 2022, MNRAS, 510, 5266 [NASA ADS] [CrossRef] [Google Scholar]
- Blank, M., Morris, M. R., Frank, A., Carroll-Nellenback, J. J., & Duschl, W. J. 2016, MNRAS, 459, 1721 [NASA ADS] [CrossRef] [Google Scholar]
- Bonnell, I. A., & Rice, W. K. M. 2008, Science, 321, 1060 [NASA ADS] [CrossRef] [Google Scholar]
- Bradford, C. M., Stacey, G. J., Nikola, T., et al. 2005, ApJ, 623, 866 [NASA ADS] [CrossRef] [Google Scholar]
- Chatzopoulos, S., Fritz, T. K., Gerhard, O., et al. 2015, MNRAS, 447, 948 [Google Scholar]
- Christopher, M. H., Scoville, N. Z., Stolovy, S. R., & Yun, M. S. 2005, ApJ, 622, 346 [Google Scholar]
- Clarke, D. A. 1996, ApJ, 457, 291 [NASA ADS] [CrossRef] [Google Scholar]
- Coker, R. F., Christopher, M. H., Stolovy, S. R., & Scoville, N. Z. 2003, Astron. Nachr. Suppl., 324, 629 [NASA ADS] [CrossRef] [Google Scholar]
- Crocker, R. M., Jones, D. I., Aharonian, F., et al. 2011, MNRAS, 413, 763 [NASA ADS] [CrossRef] [Google Scholar]
- Cunningham, A. J., Frank, A., Varnière, P., Mitran, S., & Jones, T. W. 2009, ApJS, 182, 519 [NASA ADS] [CrossRef] [Google Scholar]
- Dahmen, G., Huttemeister, S., Wilson, T. L., & Mauersberger, R. 1998, A&A, 331, 959 [Google Scholar]
- Dinh, C. K., Salas, J. M., Morris, M. R., & Naoz, S. 2021, ApJ, 920, 79 [NASA ADS] [CrossRef] [Google Scholar]
- Ehlerová, S., Palouš, J., Morris, M. R., et al. 2022, A&A, 668, A124 [NASA ADS] [CrossRef] [EDP Sciences] [Google Scholar]
- Fryxell, B., Olson, K., Ricker, P., et al. 2000, ApJS, 131, 273 [Google Scholar]
- Goicoechea, J. R., Pety, J., Chapillon, E., et al. 2018, A&A, 618, A35 [NASA ADS] [CrossRef] [EDP Sciences] [Google Scholar]
- Guerra, J. A., Lopez-Rodriguez, E., Chuss, D. T., Butterfield, N. O., & Schmelz, J. T. 2023, AJ, 166, 37 [NASA ADS] [CrossRef] [Google Scholar]
- Güsten, R., Genzel, R., Wright, M. C. H., et al. 1987, ApJ, 318, 124 [CrossRef] [Google Scholar]
- Hildebrand, R. H., Davidson, J. A., Dotson, J., et al. 1993, ApJ, 417, 565 [NASA ADS] [CrossRef] [Google Scholar]
- Hobbs, A., & Nayakshin, S. 2009, MNRAS, 394, 191 [NASA ADS] [CrossRef] [Google Scholar]
- Hsieh, P.-Y., Koch, P. M., Kim, W.-T., et al. 2021, ApJ, 913, 94 [NASA ADS] [CrossRef] [Google Scholar]
- Jackson, J. M., Geis, N., Genzel, R., et al. 1993, ApJ, 402, 173 [CrossRef] [Google Scholar]
- Liszt, H. S. 2003, A&A, 408, 1009 [NASA ADS] [CrossRef] [EDP Sciences] [Google Scholar]
- Lu, J. R. 2018, Massive Young Clusters Near the Galactic Center [Google Scholar]
- Lu, J. R., Do, T., Ghez, A. M., et al. 2013, ApJ, 764, 155 [NASA ADS] [CrossRef] [Google Scholar]
- Mapelli, M., & Trani, A. A. 2016, A&A, 585, A161 [NASA ADS] [CrossRef] [EDP Sciences] [Google Scholar]
- Mapelli, M., Hayfield, T., Mayer, L., & Wadsley, J. 2012, ApJ, 749, 168 [NASA ADS] [CrossRef] [Google Scholar]
- Melia, F. 1992, ApJ, 387, L25 [NASA ADS] [CrossRef] [Google Scholar]
- Mills, E. A. C., Güsten, R., Requena-Torres, M. A., & Morris, M. R. 2013, ApJ, 779, 47 [NASA ADS] [CrossRef] [Google Scholar]
- Mills, E. A. C., Togi, A., & Kaufman, M. 2017, ApJ, 850, 192 [NASA ADS] [CrossRef] [Google Scholar]
- Montero-Castaño, M., Herrnstein, R. M., & Ho, P. T. P. 2009, ApJ, 695, 1477 [CrossRef] [Google Scholar]
- Oka, T., Nagai, M., Kamegai, K., & Tanaka, K. 2011, ApJ, 732, 120 [NASA ADS] [CrossRef] [Google Scholar]
- Palouš, J., Ehlerová, S., Wünsch, R., & Morris, M. R. 2020, A&A, 644, A72 [NASA ADS] [CrossRef] [EDP Sciences] [Google Scholar]
- Paumard, T., Maillard, J. P., & Morris, M. 2004, A&A, 426, 81 [NASA ADS] [CrossRef] [EDP Sciences] [Google Scholar]
- Plante, R. L., Lo, K. Y., & Crutcher, R. M. 1995, ApJ, 445, L113 [NASA ADS] [CrossRef] [Google Scholar]
- Quataert, E., Narayan, R., & Reid, M. J. 1999, ApJ, 517, L101 [NASA ADS] [CrossRef] [Google Scholar]
- Requena-Torres, M. A., Güsten, R., Weiß, A., et al. 2012, A&A, 542, L21 [NASA ADS] [CrossRef] [EDP Sciences] [Google Scholar]
- Sanders, R. H. 1998, MNRAS, 294, 35 [NASA ADS] [CrossRef] [Google Scholar]
- Schure, K. M., Kosenko, D., Kaastra, J. S., Keppens, R., & Vink, J. 2009, A&A, 508, 751 [NASA ADS] [CrossRef] [EDP Sciences] [Google Scholar]
- Shakura, N. I., & Sunyaev, R. A. 1973, A&A, 24, 337 [NASA ADS] [Google Scholar]
- Solanki, S., Ressler, S. M., Murchikova, L., Stone, J. M., & Morris, M. R. 2023, ApJ, 953, 22 [NASA ADS] [CrossRef] [Google Scholar]
- Stone, J. M., Tomida, K., White, C. J., & Felker, K. G. 2020, ApJS, 249, 4 [NASA ADS] [CrossRef] [Google Scholar]
- Trani, A. A., Mapelli, M., & Ballone, A. 2018, ApJ, 864, 17 [NASA ADS] [CrossRef] [Google Scholar]
- Vollmer, B., & Duschl, W. J. 2001, A&A, 367, 72 [NASA ADS] [CrossRef] [EDP Sciences] [Google Scholar]
- Wardle, M., & Konigl, A. 1990, ApJ, 362, 120 [NASA ADS] [CrossRef] [Google Scholar]
- Wardle, M., & Yusef-Zadeh, F. 2008, ApJ, 683, L37 [NASA ADS] [CrossRef] [Google Scholar]
- Werner, M. W., Davidson, J. A., Morris, M., et al. 1988, ApJ, 333, 729 [NASA ADS] [CrossRef] [Google Scholar]
- Zhao, J.-H., Morris, M. R., Goss, W. M., & An, T. 2009, ApJ, 699, 186 [NASA ADS] [CrossRef] [Google Scholar]
All Tables
All Figures
|
Fig. 1 Initial properties of the CND in our model setup at T=0, with the disk shown in the cross section at the top, followed by face-on plots and cross-sectional plots of the initial values of physical parameters. The grid in the pressure plot (bottom line) represents the refinement of the simulation domain. |
| In the text | |
|
Fig. 2 Evolution of rotational velocities in the rotational plane (at z = 0). |
| In the text | |
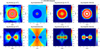 |
Fig. 3 CND properties at t = 250 kyr in the fiducial simulation. Same panels as in Figure 1. |
| In the text | |
|
Fig. 4 Relaxed CND properties after t = 500 kyr in the fiducial simulation. |
| In the text | |
|
Fig. 5 Evolution of the SN remnant with an explosion site at rGC = 1 pc in the midplane of the CND (model SN_r10_i00). |
| In the text | |
|
Fig. 6 Cumulative mass accretion from the simulation domain with a SN explosion at t = 250 kyr (the dashed red line indicates this moment). Until the CND relaxes and reaches the MHD-equilibrium (at ~200 kyr), nearly 1700 M⊙ of gas leaves the simulation domain. At the moment of the explosion, the accretion onto the central sink and the escaping mass (in the form of a mass-loaded wind) reach an approximately constant phase. The SN explosion causes an increased rate for both mass flows. |
| In the text | |
|
Fig. 7 Cumulative accretion into the central sink of CND material after SN events at different explosion sites. |
| In the text | |
|
Fig. 8 Cumulative mass of gas leaving the simulation domain after SN events at different explosion sites. |
| In the text | |
|
Fig. 9 Additional mass inflow caused by SNe occurring in the rotational plane as a function of the galactocentric distance of the explosion site. The accretion is estimated 200 kyr after the explosion (t = 450 kyr) by subtracting the accretion of the fiducial model. |
| In the text | |
Current usage metrics show cumulative count of Article Views (full-text article views including HTML views, PDF and ePub downloads, according to the available data) and Abstracts Views on Vision4Press platform.
Data correspond to usage on the plateform after 2015. The current usage metrics is available 48-96 hours after online publication and is updated daily on week days.
Initial download of the metrics may take a while.