Open Access
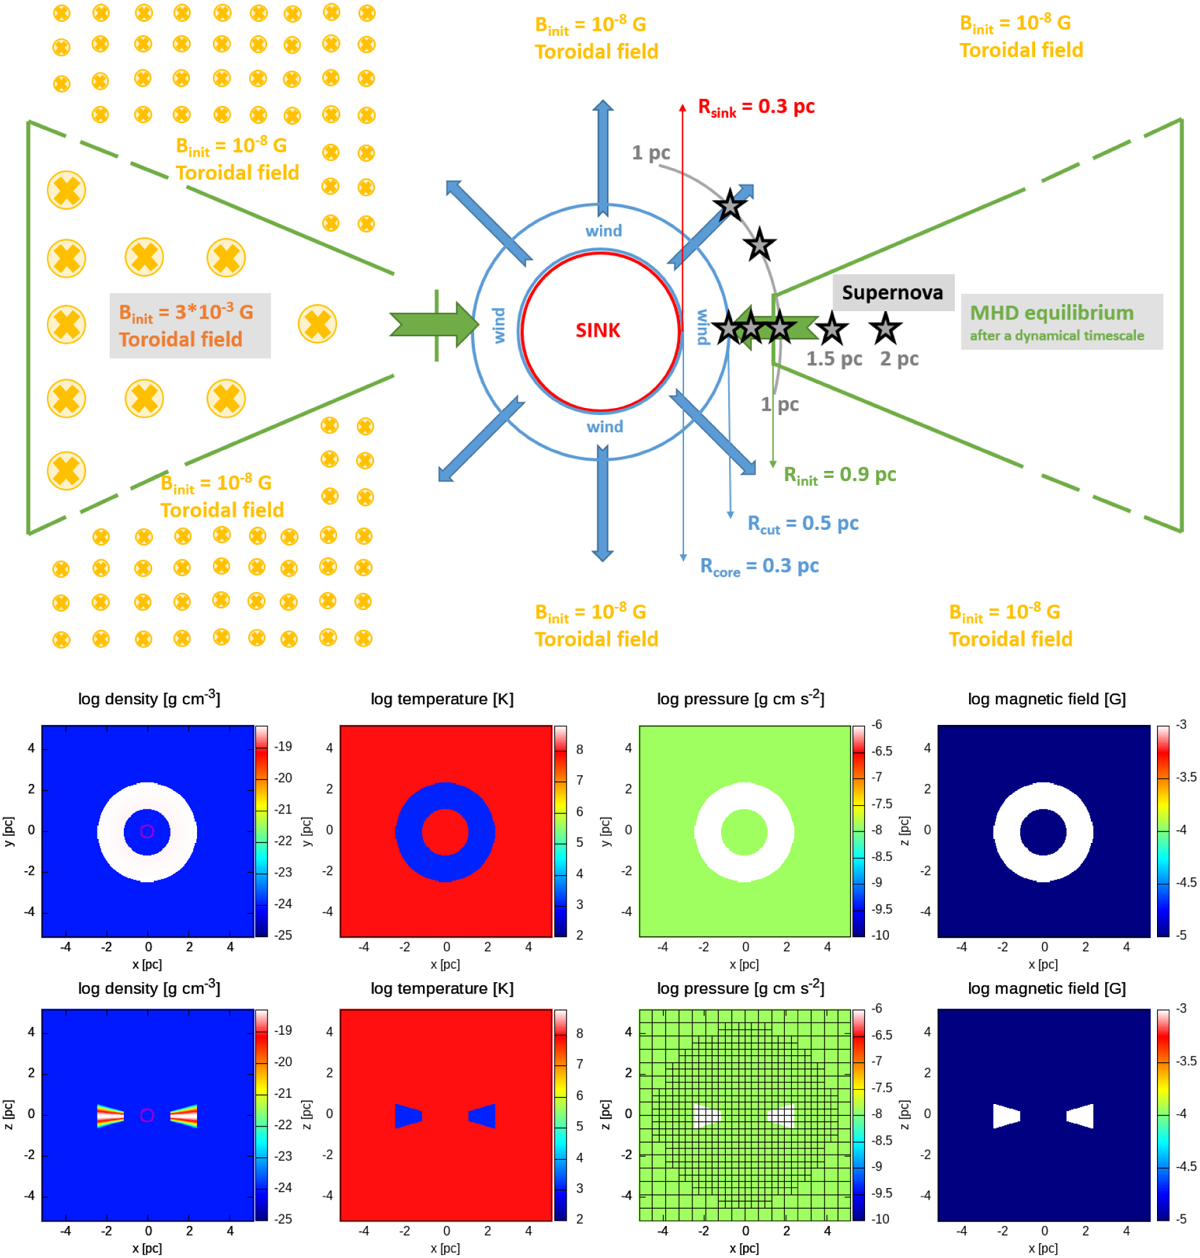
Fig. 1
Download original image
Initial properties of the CND in our model setup at T=0, with the disk shown in the cross section at the top, followed by face-on plots and cross-sectional plots of the initial values of physical parameters. The grid in the pressure plot (bottom line) represents the refinement of the simulation domain.
Current usage metrics show cumulative count of Article Views (full-text article views including HTML views, PDF and ePub downloads, according to the available data) and Abstracts Views on Vision4Press platform.
Data correspond to usage on the plateform after 2015. The current usage metrics is available 48-96 hours after online publication and is updated daily on week days.
Initial download of the metrics may take a while.