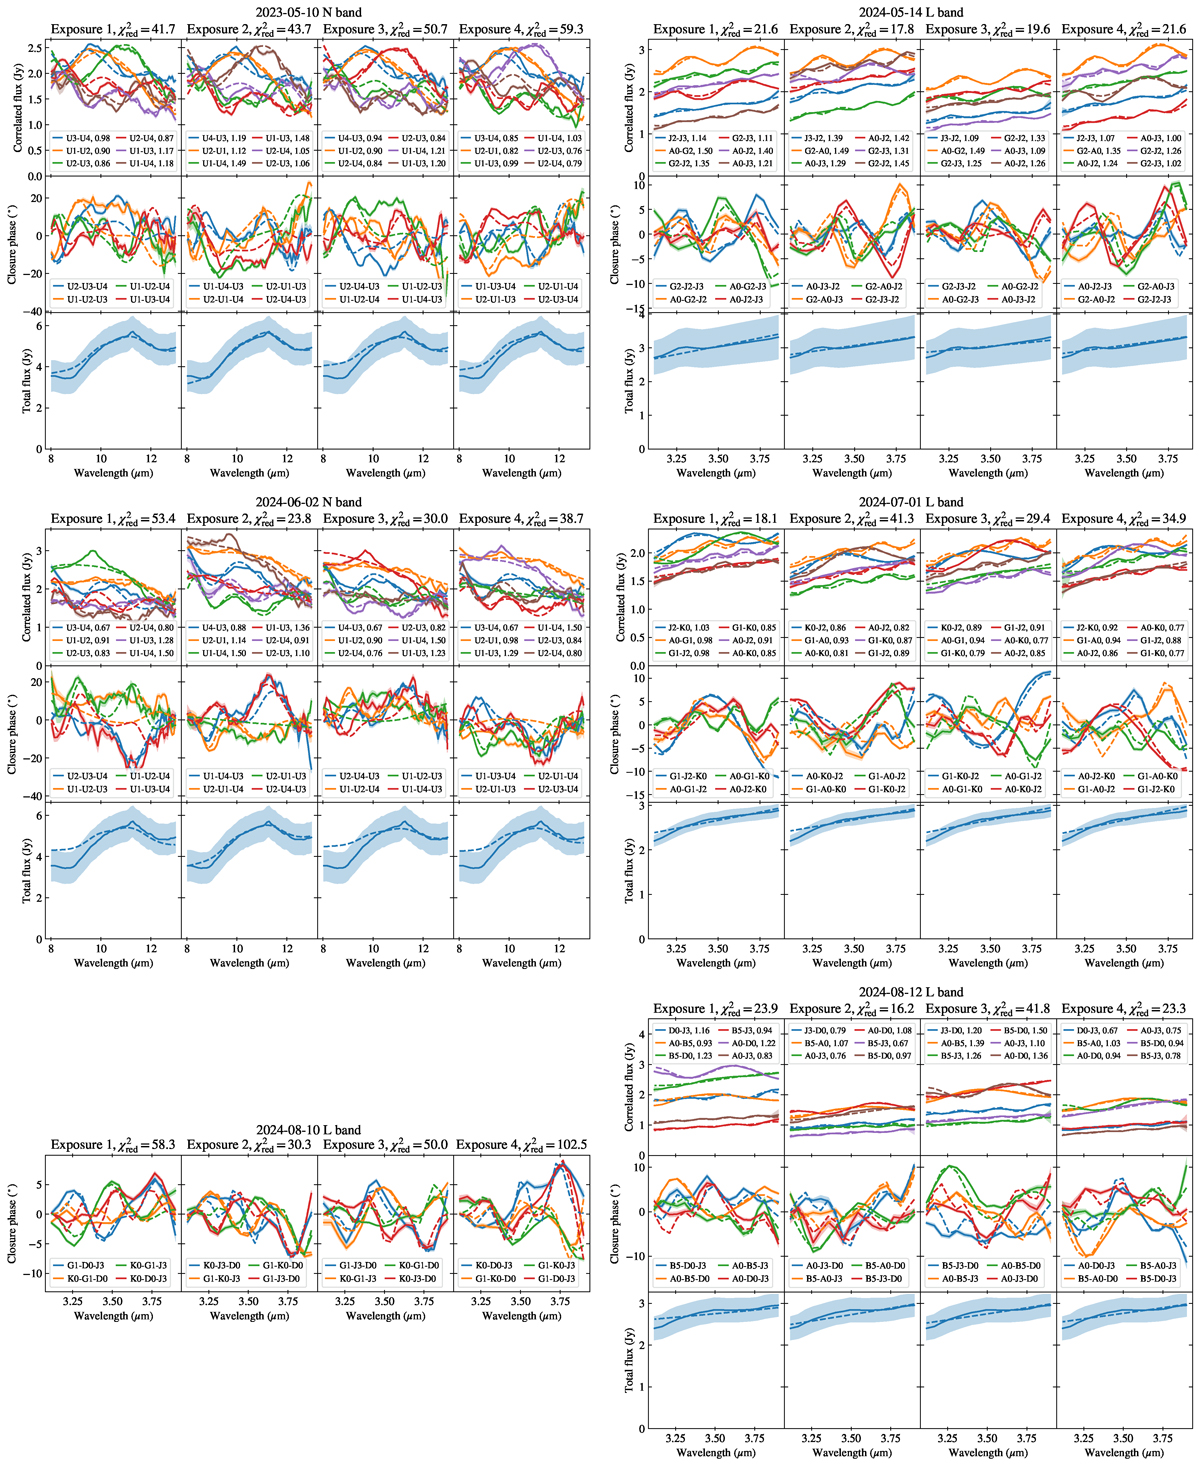
Fig. C.2.
Download original image
Fits to the individual exposures in the second stage of our modeling. Each large three by four panel corresponds to a single epoch observation. A column in a panel shows the fits to a particular exposure, with the correlated flux on the top, closure phase in the middle, and single-dish flux at the bottom. The data are shown as solid lines, and the model as dashed lines. Correction factors are indicated in the legend of the correlated flux plots, for each baseline. The 2024 Aug 10 data set is incomplete, and thus only the closure phases were fitted.
Current usage metrics show cumulative count of Article Views (full-text article views including HTML views, PDF and ePub downloads, according to the available data) and Abstracts Views on Vision4Press platform.
Data correspond to usage on the plateform after 2015. The current usage metrics is available 48-96 hours after online publication and is updated daily on week days.
Initial download of the metrics may take a while.