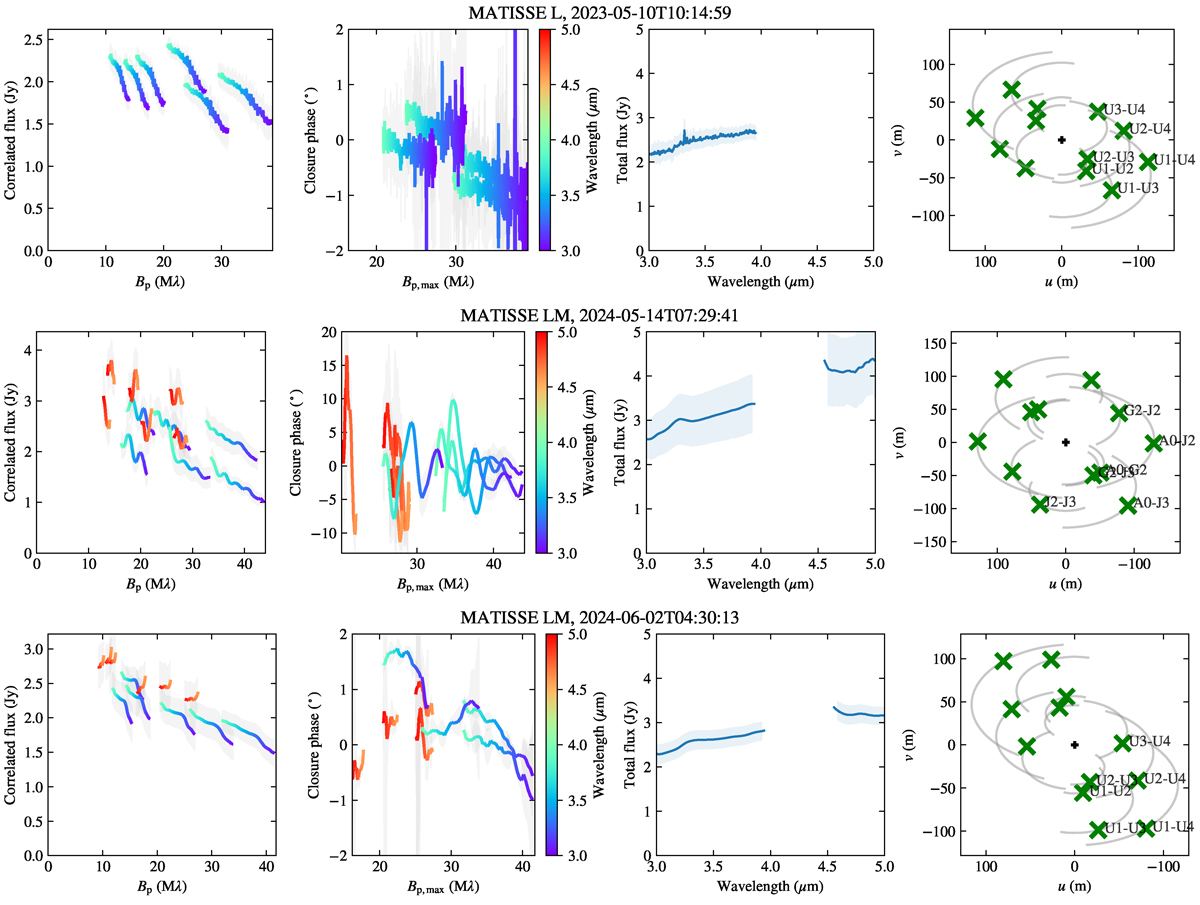
Fig. A.1.
Download original image
Calibrated MATISSE L- and LM-band data sets with pipeline produced uncertainties. First column: Correlated flux as a function of the spatial frequency. Second column: Closure phase as a function of the spatial frequency corresponding to the longest baselines of the triangles. Third column: Single-dish flux as a function of the wavelength. Fourth column: uv coverage of the observations. The correlated flux and the closure phase values are the average over the four non-chopped exposures of each observation, while the single-dish flux values are the average over the eight chopped exposures. The 2023 May 10 and 2024 June 2 data are UT observations, the rest are AT observations.
Current usage metrics show cumulative count of Article Views (full-text article views including HTML views, PDF and ePub downloads, according to the available data) and Abstracts Views on Vision4Press platform.
Data correspond to usage on the plateform after 2015. The current usage metrics is available 48-96 hours after online publication and is updated daily on week days.
Initial download of the metrics may take a while.