Fig. 3.
Download original image
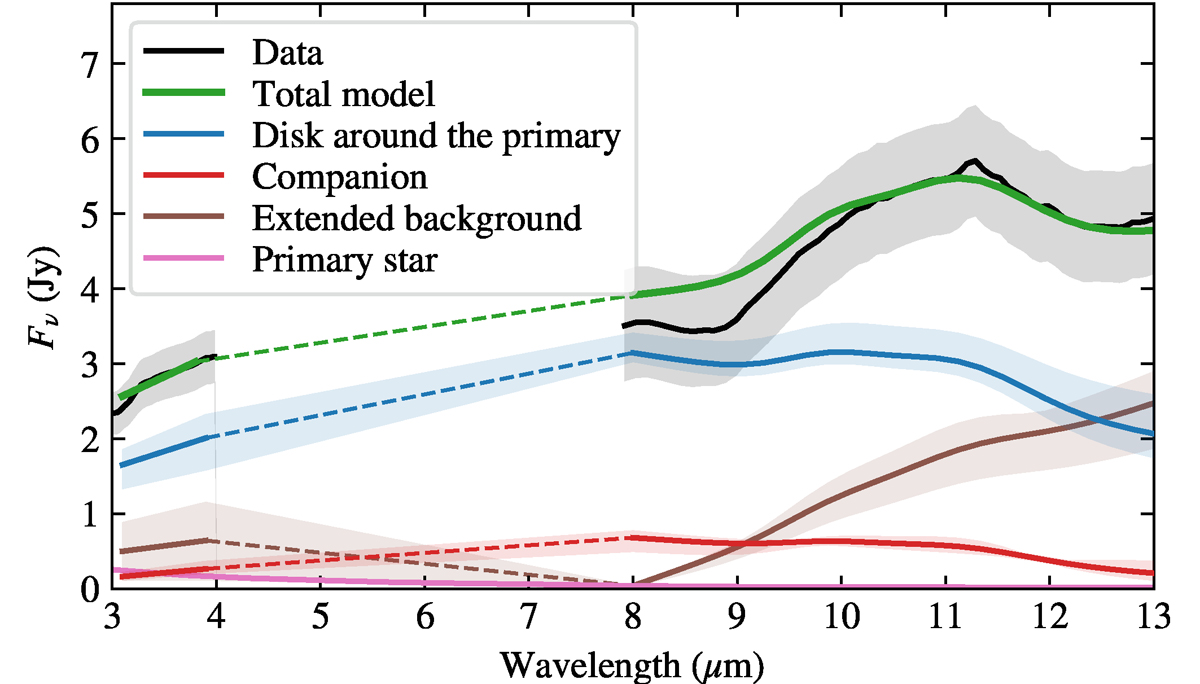
Our fit to the L- and N-band SED of T CrA. The L-band data are the average of the three MATISSE AT single-dish spectra taken in 2024, while the N-band spectrum was taken in 2008 by Spitzer. The SED of the central star is extracted from the SED modeling of Rigliaco et al. (2023). The dashed lines indicate the model SED interpolated between the L and N bands.
Current usage metrics show cumulative count of Article Views (full-text article views including HTML views, PDF and ePub downloads, according to the available data) and Abstracts Views on Vision4Press platform.
Data correspond to usage on the plateform after 2015. The current usage metrics is available 48-96 hours after online publication and is updated daily on week days.
Initial download of the metrics may take a while.