Fig. 6
Download original image
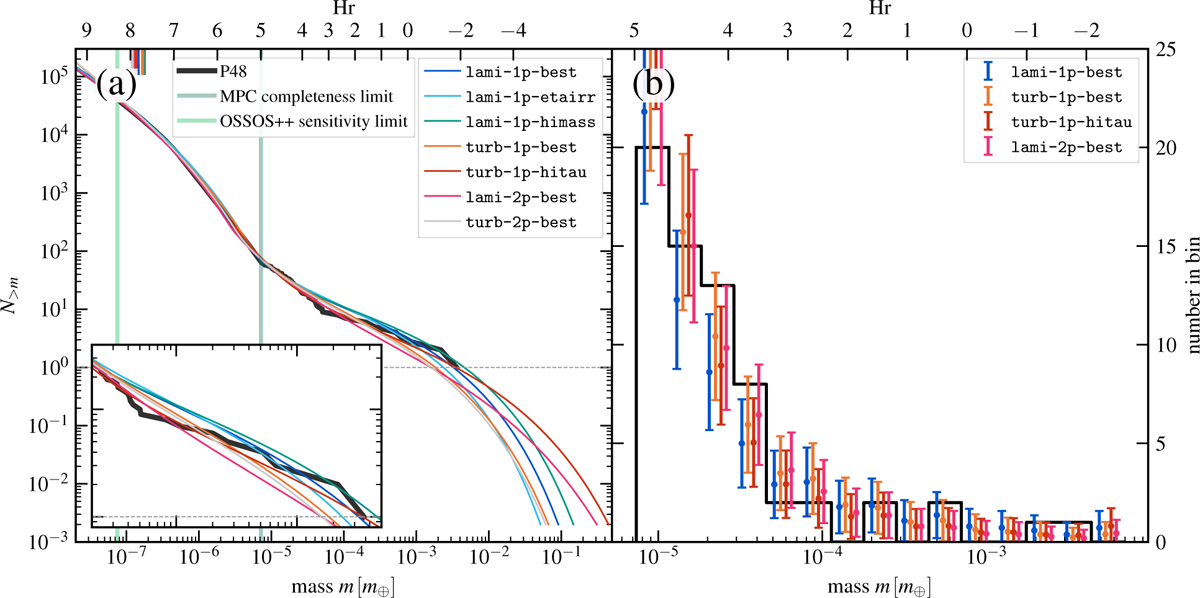
Cumulative distributions (a) and histograms (b) of sample model runs. An implantation factor of fimpl = 2 × 10⁻³ has been applied, after which the simulated distributions can be compared to the P48 population (black). In (b) the low number of bodies (and large Poisson error bars) illustrate why the fits tend to be rather insensitive to the specifics at the high-mass end of the distribution. Runs featuring small τs are associated with high σ due to the degeneracy between these quantities (see Table 3). Runs with small τs are disfavored, however, as pebble accretion operates too slowly.
Current usage metrics show cumulative count of Article Views (full-text article views including HTML views, PDF and ePub downloads, according to the available data) and Abstracts Views on Vision4Press platform.
Data correspond to usage on the plateform after 2015. The current usage metrics is available 48-96 hours after online publication and is updated daily on week days.
Initial download of the metrics may take a while.