Fig. 2

Download original image
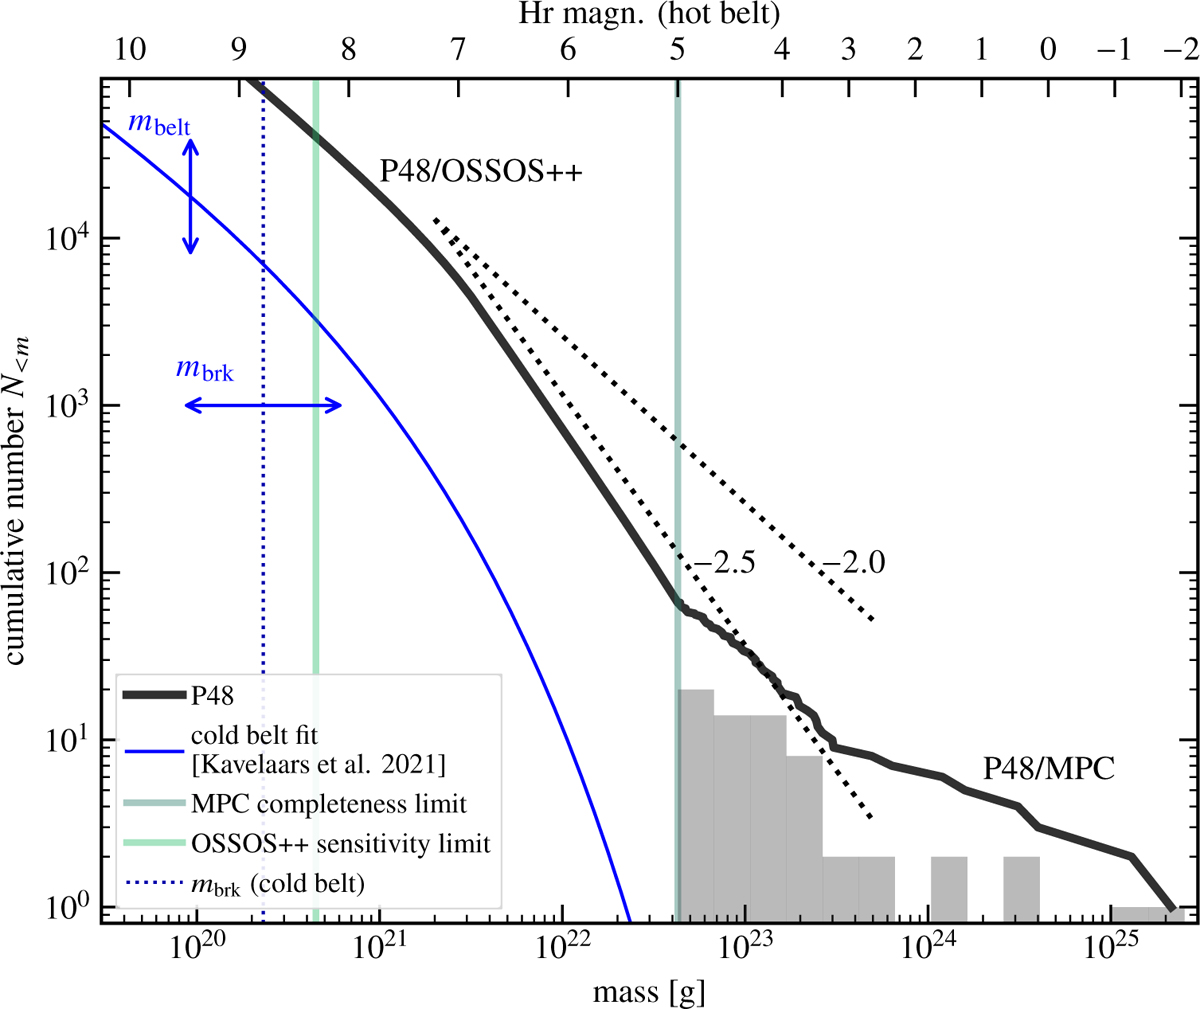
Cumulative number distribution (N<m) of bodies in the cold belt and the dynamical hot P48. The cold belt is well described by the analytical fit of Kavelaars et al. (2021) (Equation (2)), whose shape is assumed to be identical to the distribution of the bodies in the primordial belt. Population P48 is reconstructed by taking all bodies brighter than Hr = 5 and within 48 au from the MPC database (histograms) while bodies 5 ≤ Hr ≤ 8.3 are assumed to follow the completeness-corrected distribution from OSSOS++. The corresponding cumulative mass function is given by the black curve. The conversion between mass and magnitude (top) assumes an albedo typical for hot belt bodies (see Appendix A). The dotted lines labeled p = −2.0 and p = −2.5 correspond to N<m ∝ m1+p with p = −2 indicating an equal amount of mass per logarithmically spaced mass bin (the corresponding indices in terms of a radius spectrum dN/dR ∝ Rq are q = −4 and q = −5.5, respectively). Pebble accretion operates to selectively grow the largest TNOs, flattening the size distribution.
Current usage metrics show cumulative count of Article Views (full-text article views including HTML views, PDF and ePub downloads, according to the available data) and Abstracts Views on Vision4Press platform.
Data correspond to usage on the plateform after 2015. The current usage metrics is available 48-96 hours after online publication and is updated daily on week days.
Initial download of the metrics may take a while.


