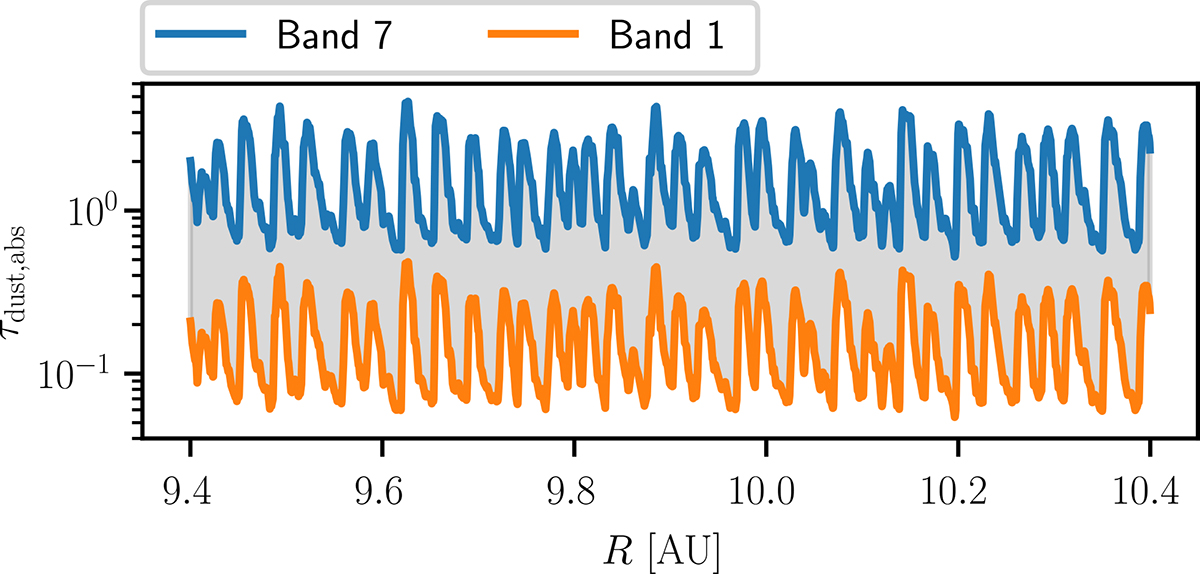
Fig. C.2.
Download original image
Dust optical depth after 100 orbits as a function of radius for the simulation with Z = 0.02. The disk we consider here is gained by rescaling the density from the simulation in Fig. 2 by a factor of 6.5. The grey region between both curves indicates the possible values of optical depth that are relevant for observations between Band 1 and Band 7.
Current usage metrics show cumulative count of Article Views (full-text article views including HTML views, PDF and ePub downloads, according to the available data) and Abstracts Views on Vision4Press platform.
Data correspond to usage on the plateform after 2015. The current usage metrics is available 48-96 hours after online publication and is updated daily on week days.
Initial download of the metrics may take a while.