Open Access
Fig. 3.
Download original image
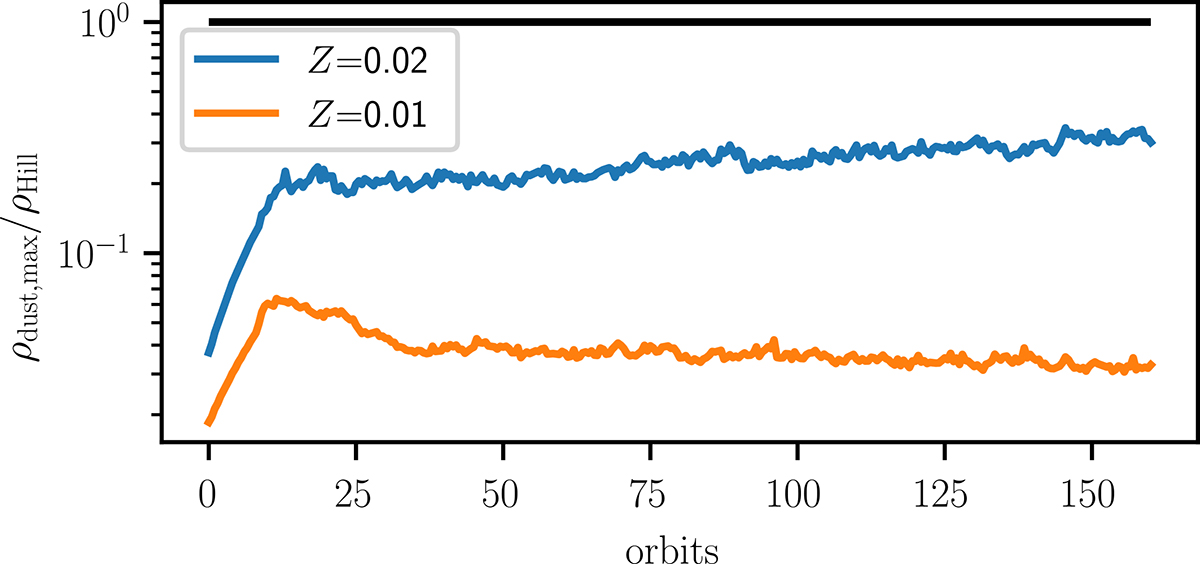
Evolution of the maximum dust density between 9.4 and 10.4 au over 160 orbits for the considered simulations. The black line indicates the density ratio clumps must reach to collapse under their gravity. The chosen domain is meant not to exclude clumps that are an artifact from the outer boundary.
Current usage metrics show cumulative count of Article Views (full-text article views including HTML views, PDF and ePub downloads, according to the available data) and Abstracts Views on Vision4Press platform.
Data correspond to usage on the plateform after 2015. The current usage metrics is available 48-96 hours after online publication and is updated daily on week days.
Initial download of the metrics may take a while.