Open Access
Fig. 2.
Download original image
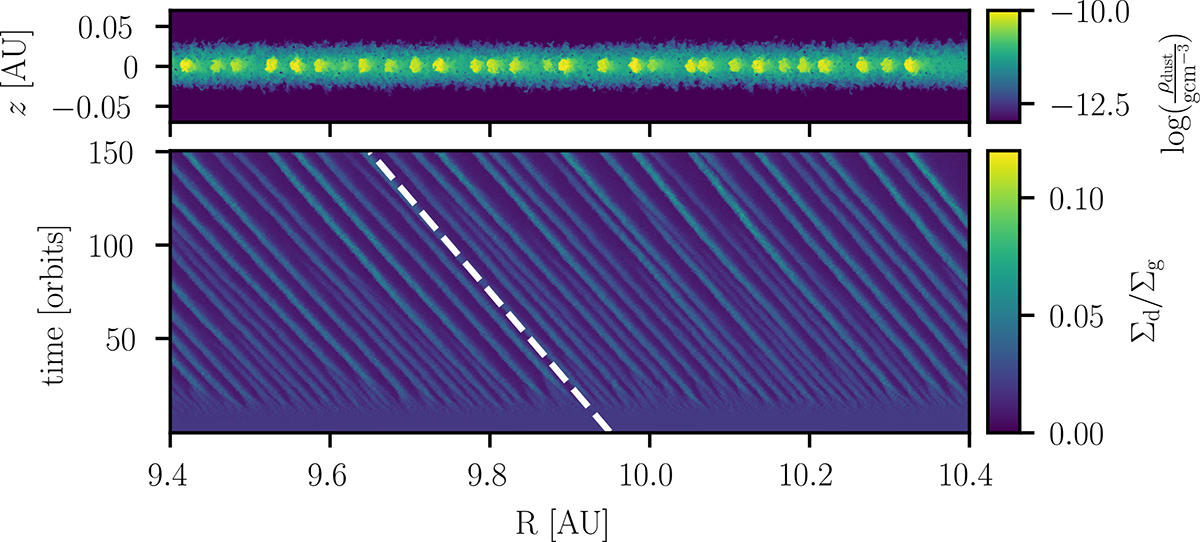
Evolution of the disk with Σd/Σg = 0.02. Top: 2D dust density after 160 orbits, bottom: evolution of the surface density ratio over 160 orbits. The white dashed line shows the theoretical radial drift with a constant drift velocity of vr, clump = 30 cm s−1.
Current usage metrics show cumulative count of Article Views (full-text article views including HTML views, PDF and ePub downloads, according to the available data) and Abstracts Views on Vision4Press platform.
Data correspond to usage on the plateform after 2015. The current usage metrics is available 48-96 hours after online publication and is updated daily on week days.
Initial download of the metrics may take a while.