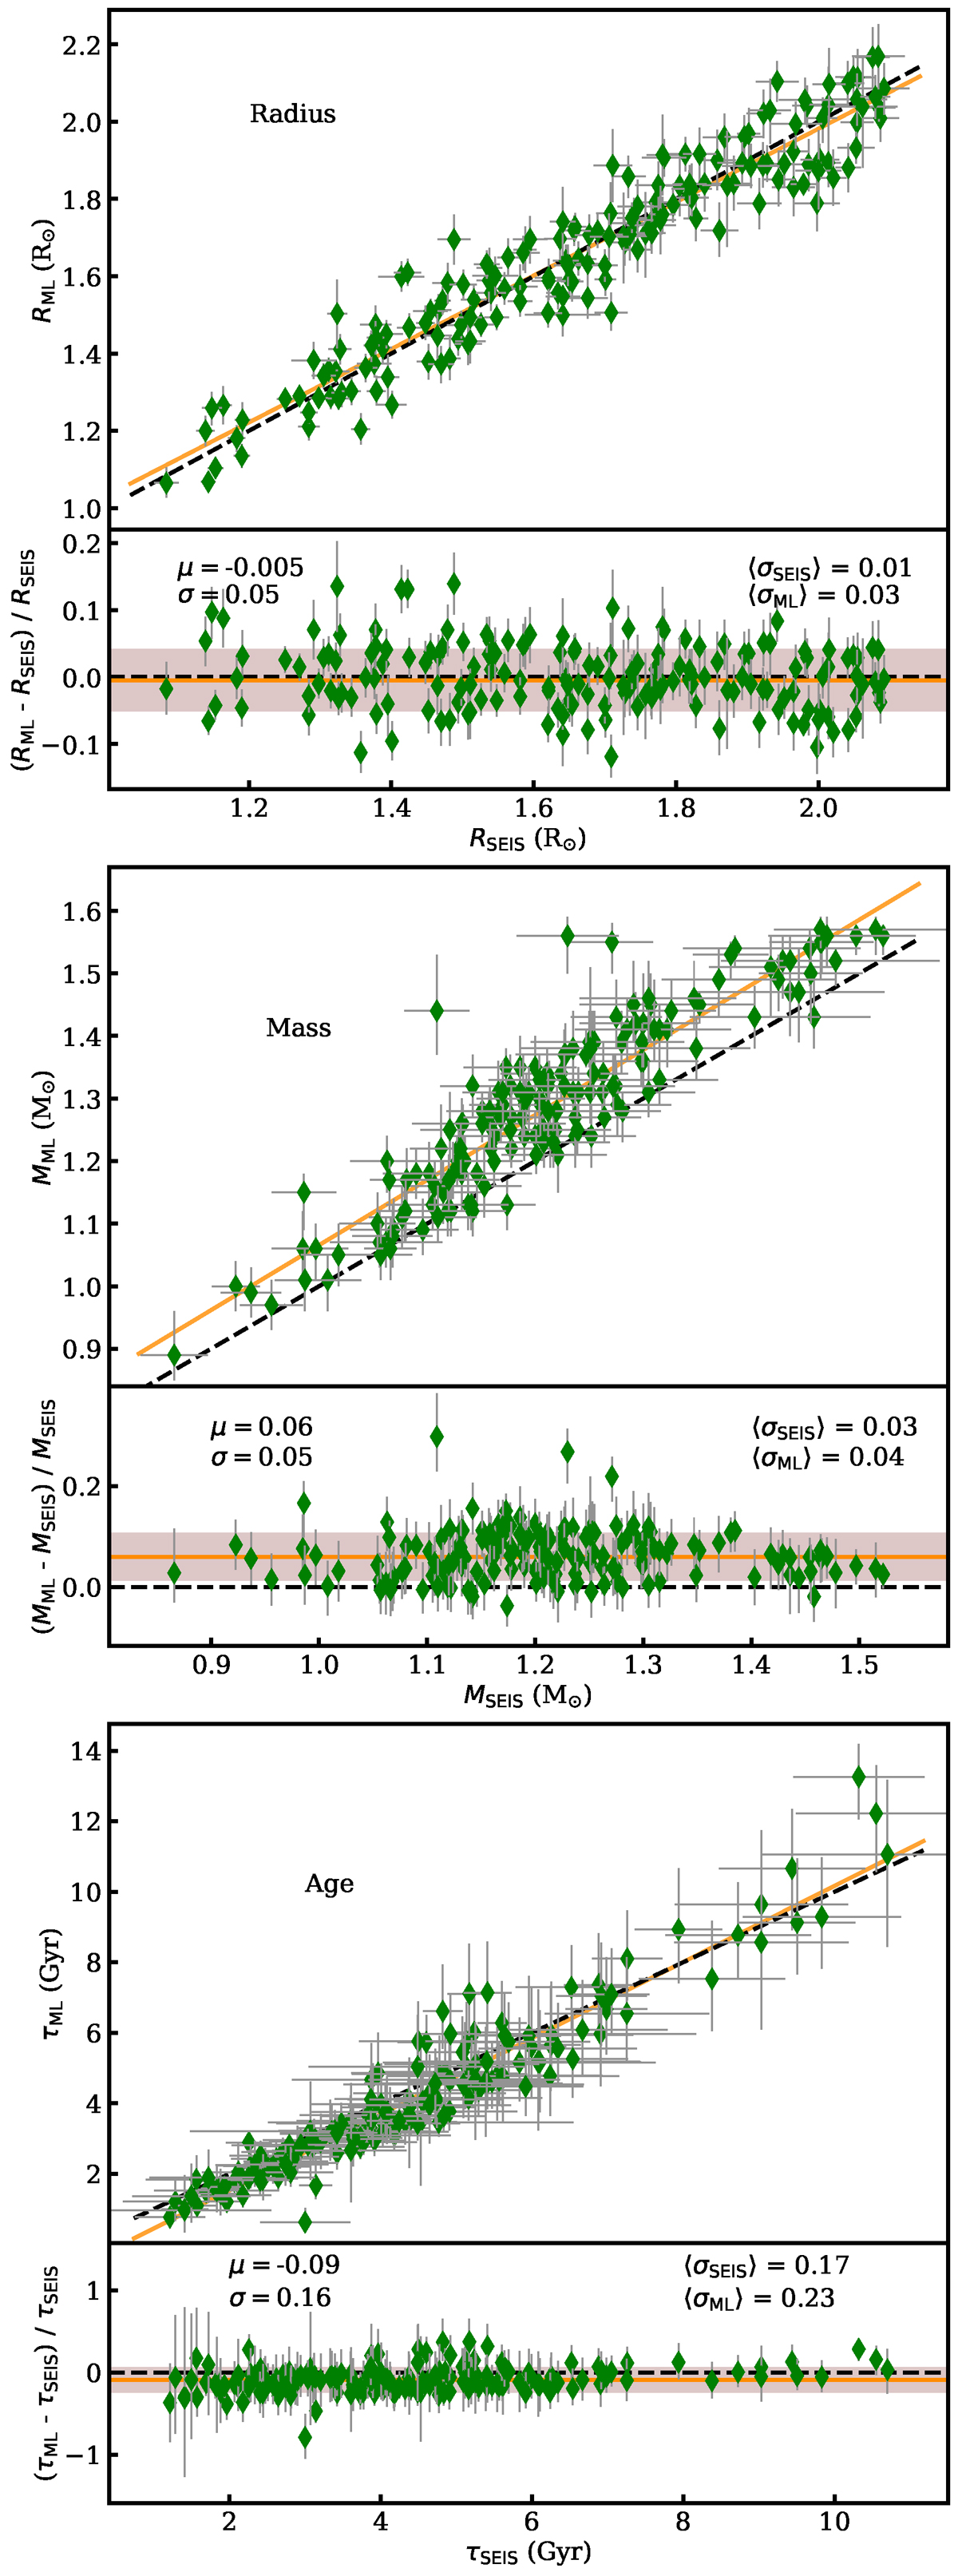
Fig. 5.
Download original image
One-to-one relation and fractional differences from MAISTEP with respect to APOKASC as the reference values, for radius (top), mass (middle), and age (bottom). The black dashed lines in all panels represent the unity relation. The orange line in the one-to-one plots indicates the best-fit line while in the fractional difference plots, it represents the mean offset/bias, μ. The brown shaded region highlights the associated scatter, ±σ. Additionally, we give the average statistical relative uncertainties in angle brackets.
Current usage metrics show cumulative count of Article Views (full-text article views including HTML views, PDF and ePub downloads, according to the available data) and Abstracts Views on Vision4Press platform.
Data correspond to usage on the plateform after 2015. The current usage metrics is available 48-96 hours after online publication and is updated daily on week days.
Initial download of the metrics may take a while.