Fig. D.1.
Download original image
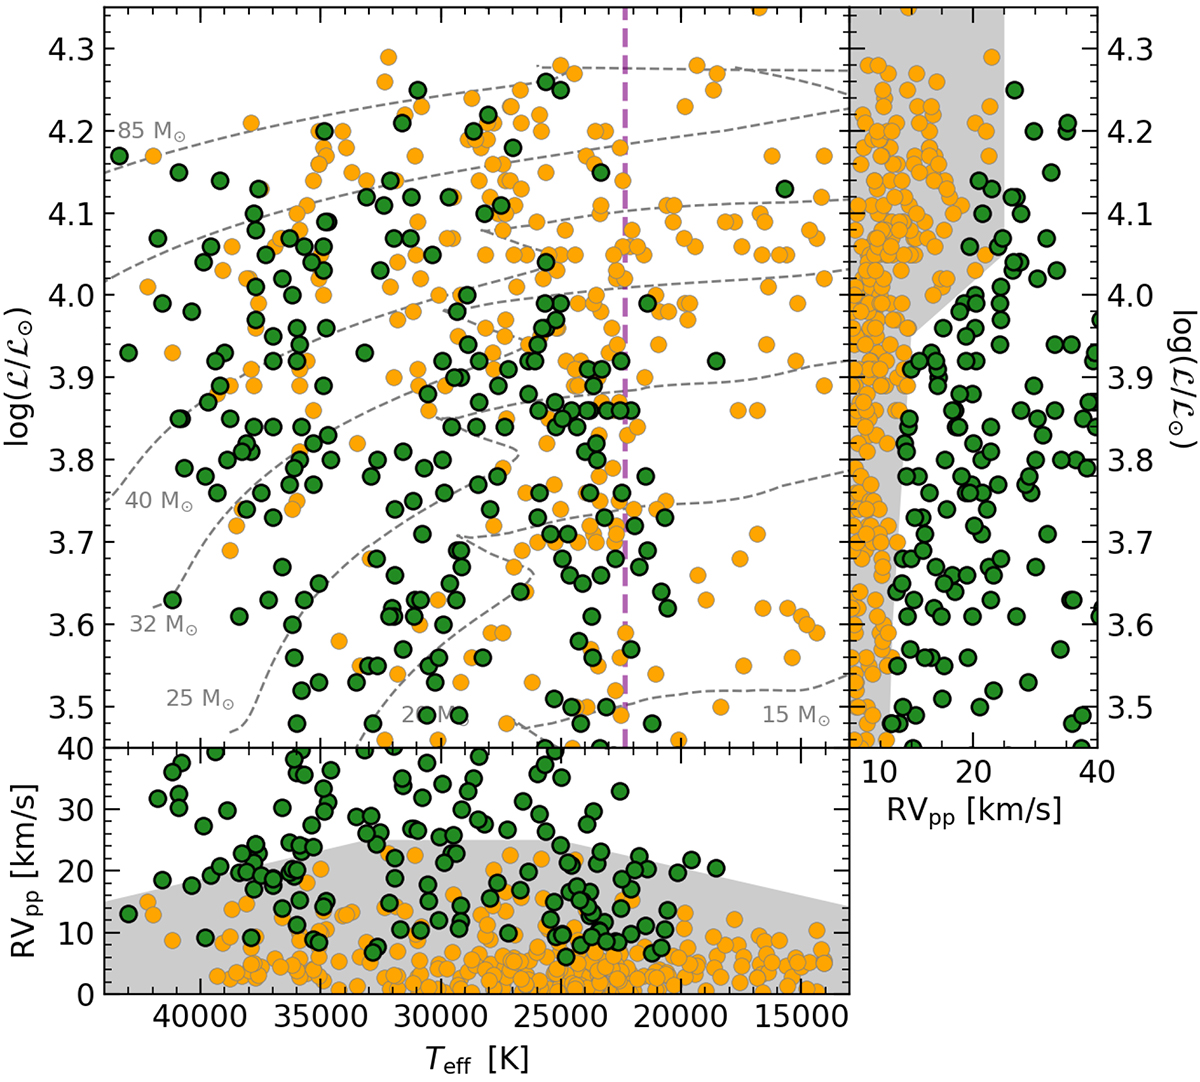
spectroscopic Hertzsprung-Russell diagram of the stars in the sample within 2500 pc with three or more available multi-epoch spectra. Green circles correspond to systems identified as SB1. The bottom and right subpanels show RVpp against Teff and log(ℒ/ℒ⊙), respectively. The gray areas highlight the threshold limits for detection of SB1 systems (see Appendix D). The evolutionary tracks correspond to nonrotating Geneva models. The average Teff of our proposed TAMS is shown with a dashed purple line.
Current usage metrics show cumulative count of Article Views (full-text article views including HTML views, PDF and ePub downloads, according to the available data) and Abstracts Views on Vision4Press platform.
Data correspond to usage on the plateform after 2015. The current usage metrics is available 48-96 hours after online publication and is updated daily on week days.
Initial download of the metrics may take a while.