Fig. 7.
Download original image
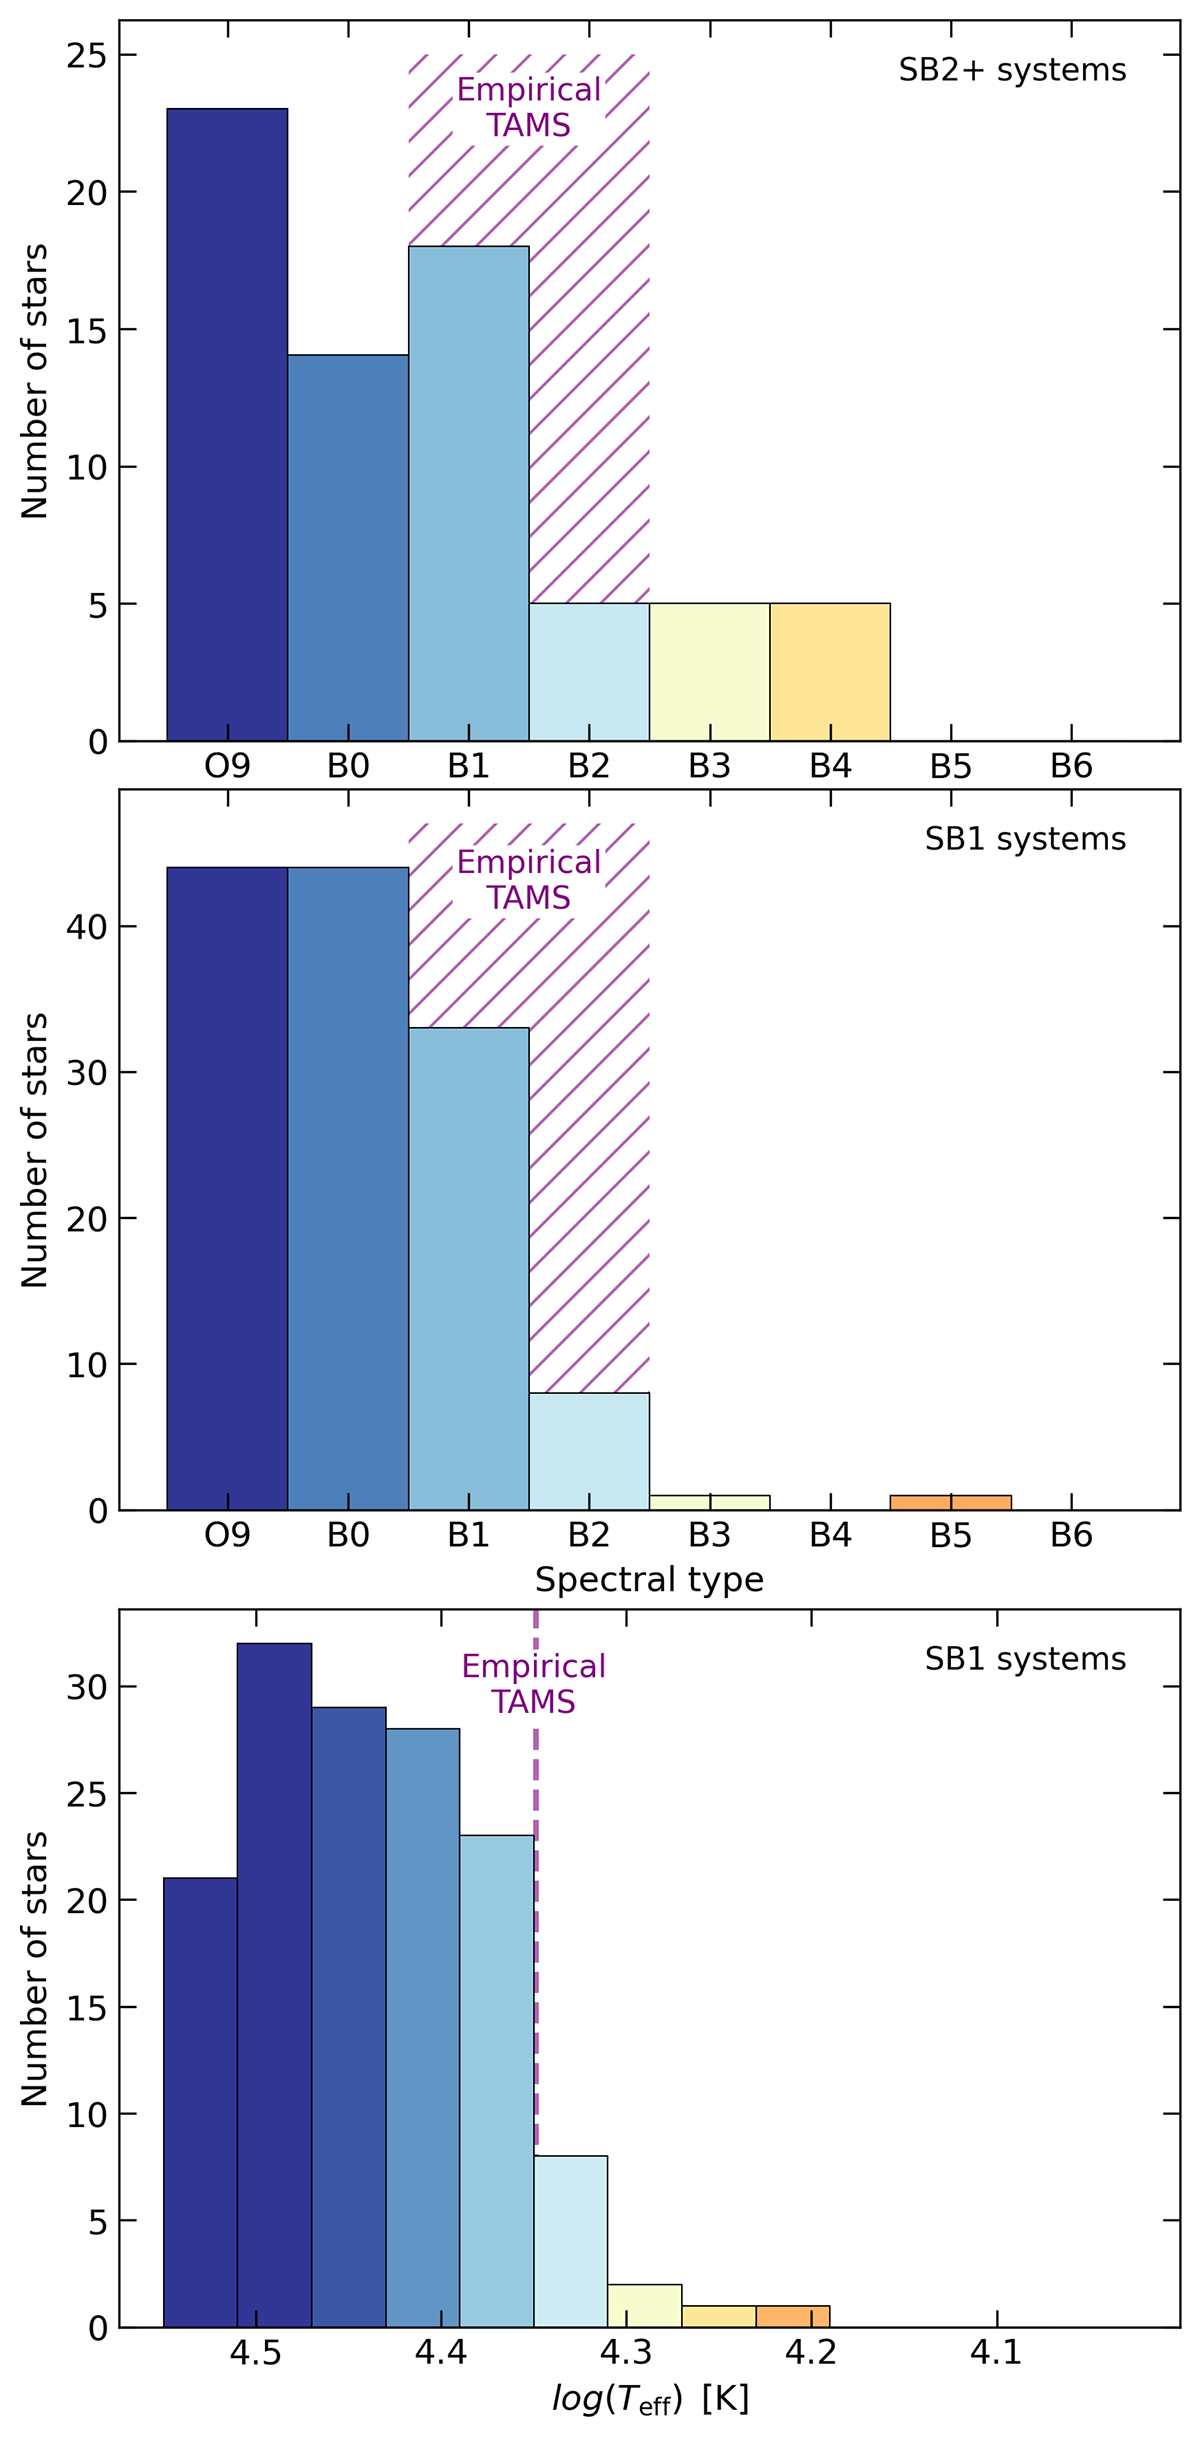
Histograms of the number of spectroscopic binaries against spectral type or log10(Teff), limited to a distance of 2500 pc. The top panel include SB2+ systems for which the spectral type is taken from the primary star (see also Sect. 5.2 for further details). The middle panel is similar to the top one but including the SB1 systems detected from the RVpp variability. The bottom panel include the same stars as in the middle one, but we used the log(Teff) instead of the spectral type. In the top two panels, the position of the TAMS is highlighted with a patch of purple lines, derived from the range of spectral types of stars within 1 kK of the average Teff of the TAMS, which is shown in the bottom panel as a dashed purple line.
Current usage metrics show cumulative count of Article Views (full-text article views including HTML views, PDF and ePub downloads, according to the available data) and Abstracts Views on Vision4Press platform.
Data correspond to usage on the plateform after 2015. The current usage metrics is available 48-96 hours after online publication and is updated daily on week days.
Initial download of the metrics may take a while.