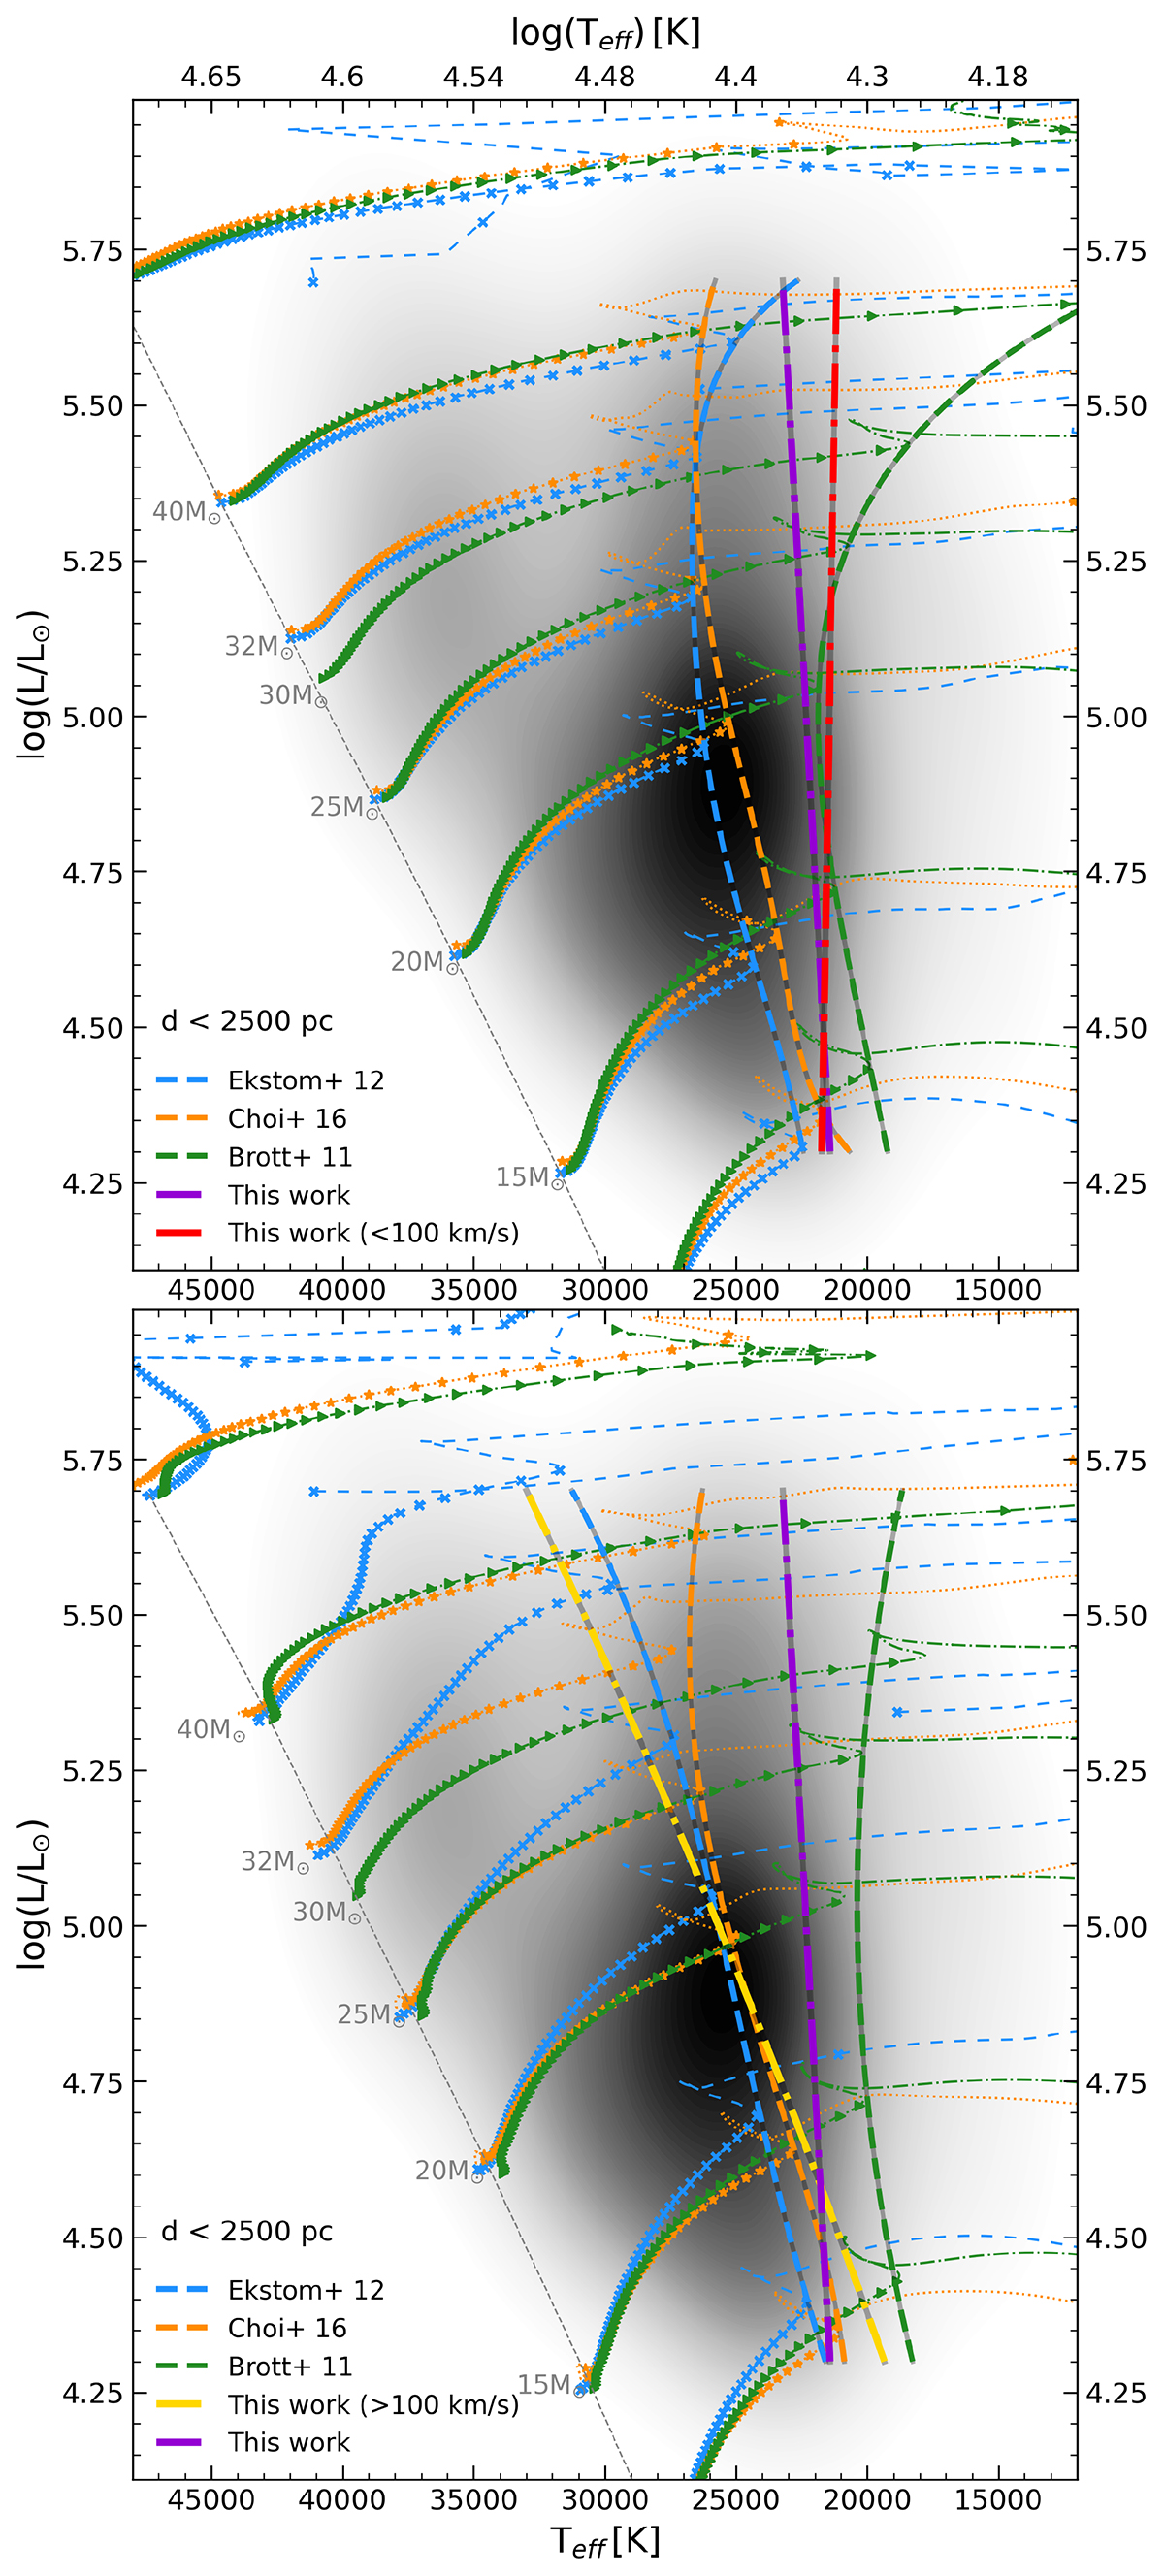
Fig. 5.
Download original image
Hertzsprung-Russell diagrams showing different evolutionary tracks for solar metallicity together with different predictions for the location of the TAMS as indicated in each legend. The top panel includes tracks with no initial rotation, and in the bottom panel the tracks correspond to vini/vcrit ≈ 0.4. Intervals of the same age difference are marked with different symbols. The gray density mesh in the background is based on a Gaussian kernel and includes our sample stars up to 2500 pc. Evolutionary tracks are limited up to the RSg phase (if applicable).
Current usage metrics show cumulative count of Article Views (full-text article views including HTML views, PDF and ePub downloads, according to the available data) and Abstracts Views on Vision4Press platform.
Data correspond to usage on the plateform after 2015. The current usage metrics is available 48-96 hours after online publication and is updated daily on week days.
Initial download of the metrics may take a while.