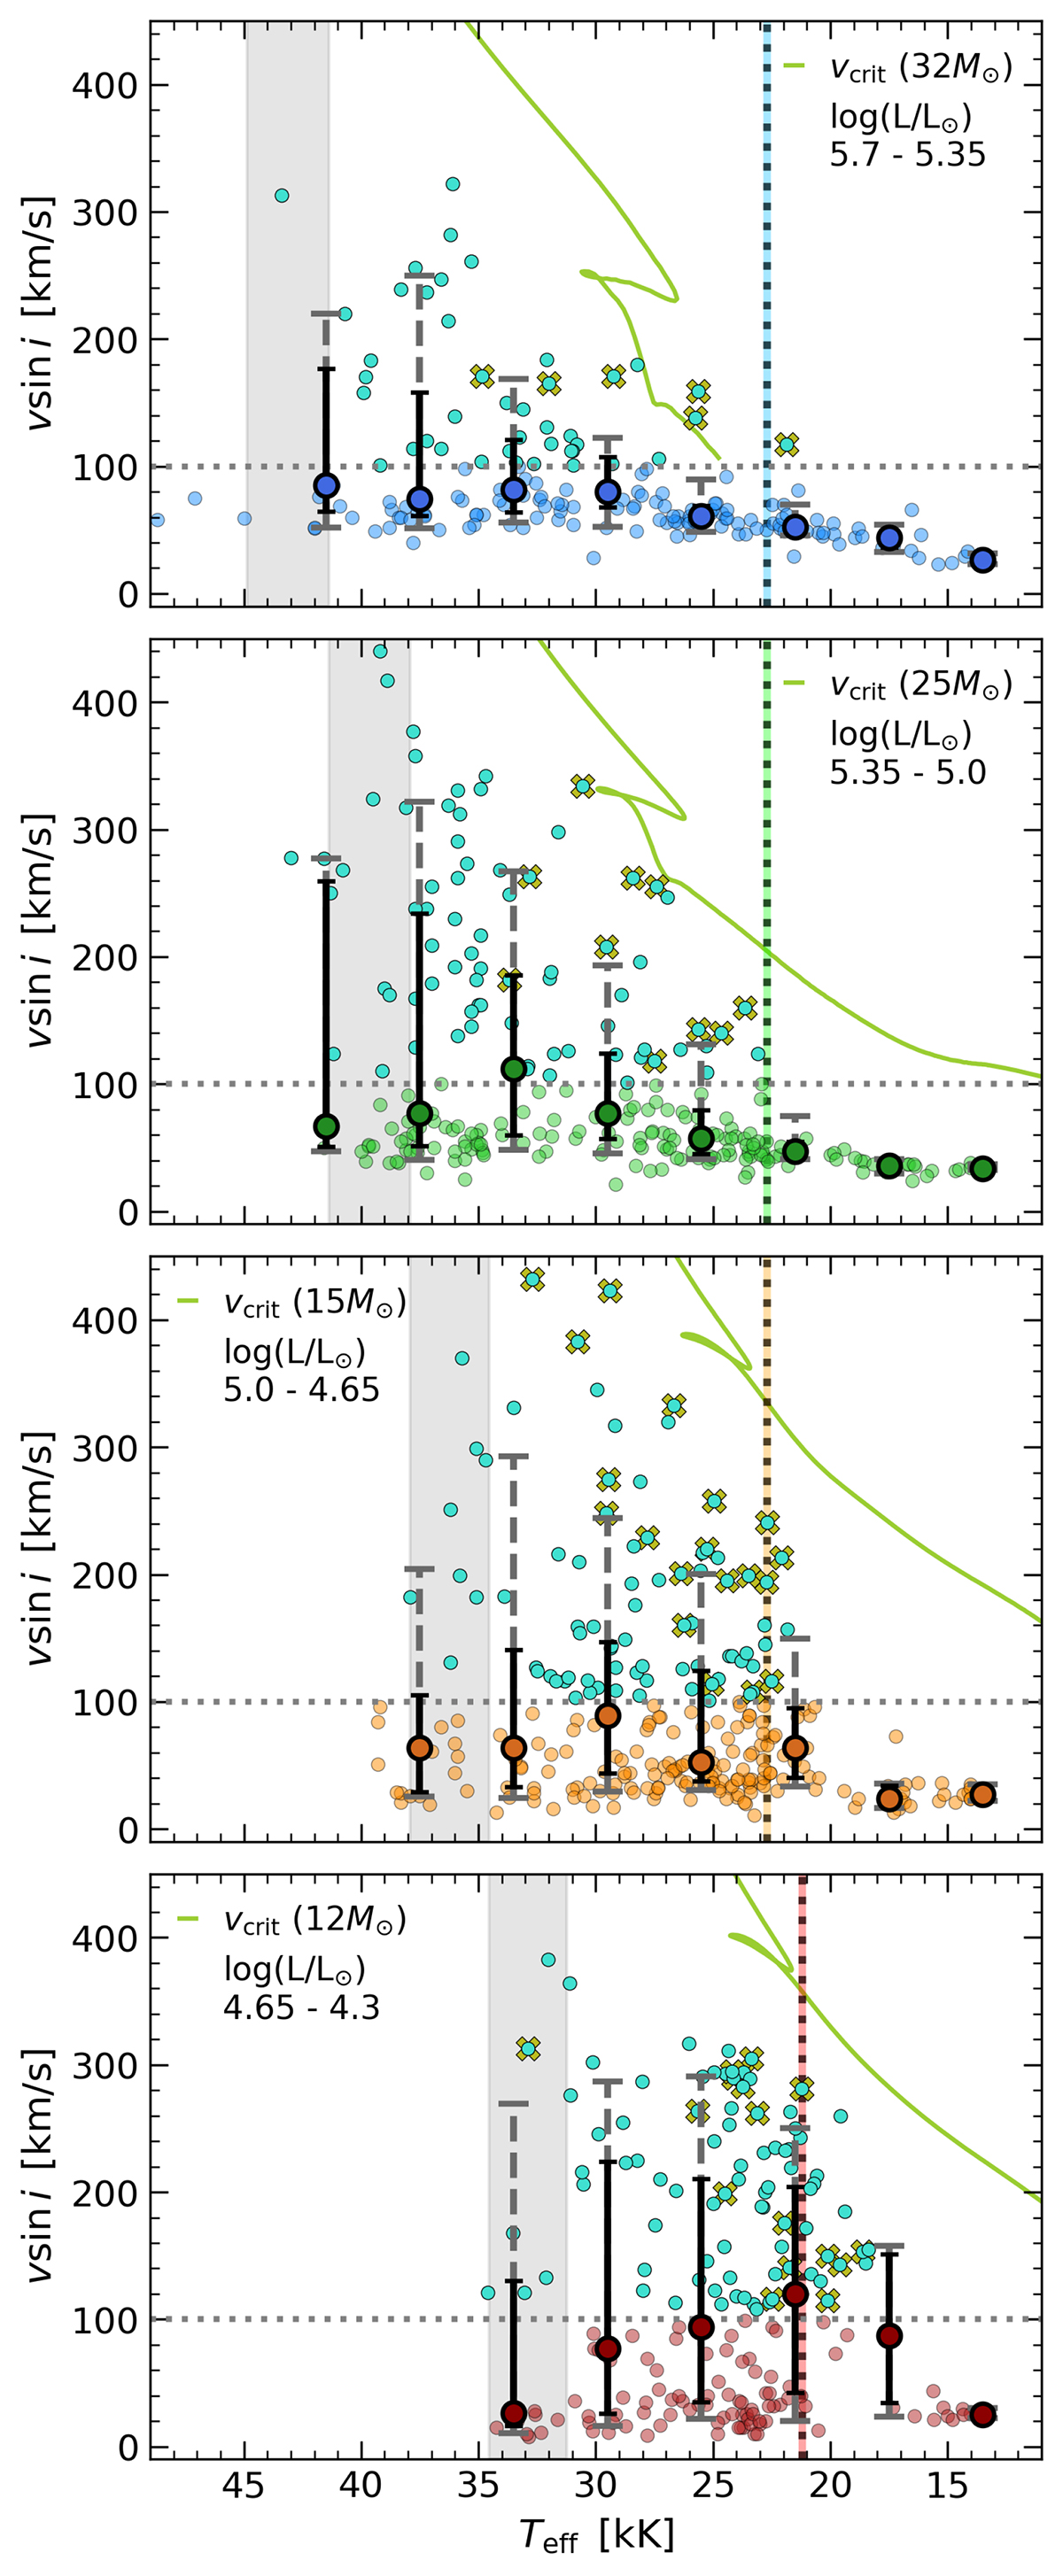
Fig. 4.
Download original image
Projected rotational velocities of the stars in our sample against their effective temperature. In this case, the sample is not limited to any distance. The panels separate stars into different luminosity ranges as in Fig. 3, following the same color code. Solid black error bars and central circles indicate the 75% and 25% percentiles and the median values of the stars in bins of 4 kK. The dashed gray error bars correspond to the 90% and 10% percentiles. The dotted line at 100 km s−1 separates fast-rotating stars. The location of the TAMS is also included with a vertical dotted line. The solid green lines correspond to the critical velocity calculated from the models in Fig. 2. Stars showing double sub-peak emission in Hα are marked with additional lime-colored crosses (see Appendix B). The gray area corresponds to the temperature range covered by the theoretical ZAMS in each luminosity range.
Current usage metrics show cumulative count of Article Views (full-text article views including HTML views, PDF and ePub downloads, according to the available data) and Abstracts Views on Vision4Press platform.
Data correspond to usage on the plateform after 2015. The current usage metrics is available 48-96 hours after online publication and is updated daily on week days.
Initial download of the metrics may take a while.