Fig. 3.
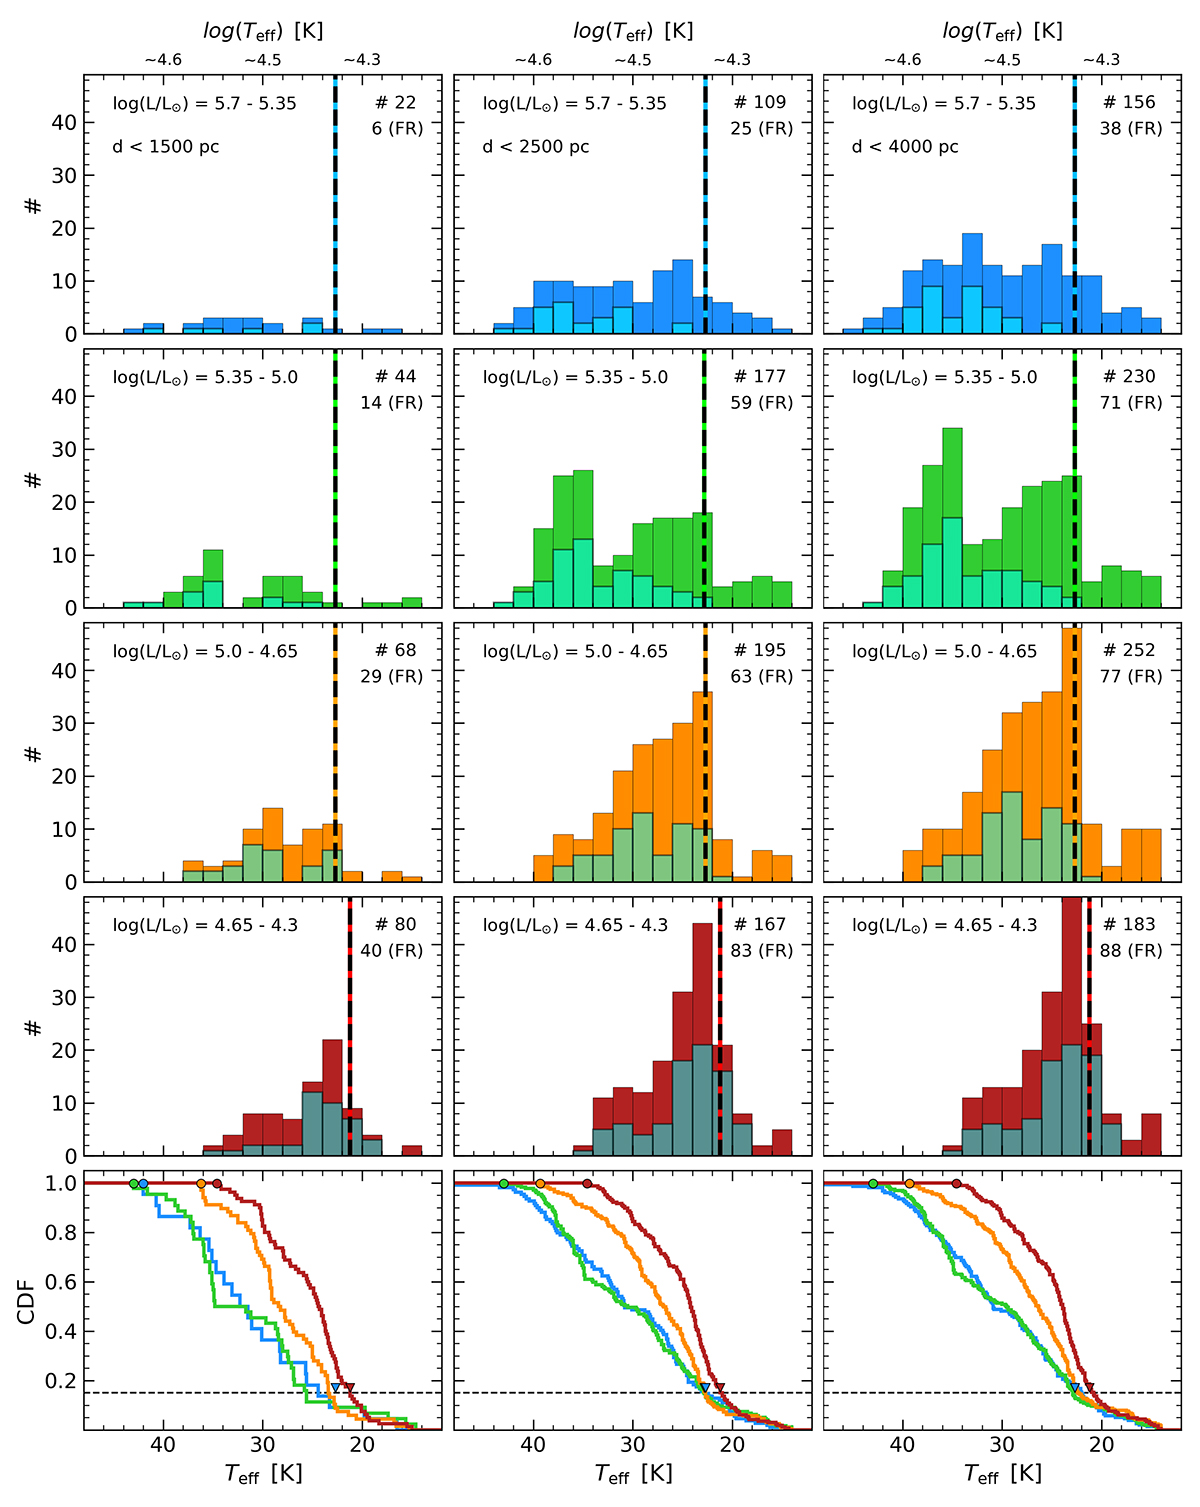
Download original image
Number of stars with respect to their effective temperature. The histograms in the top four rows of subpanels separate stars within the indicated range of luminosities using different colors. Cyan bins indicate fast-rotating stars with v sin i > 100 km s−1. Each histogram displays the total number of stars and of fast-rotating objects (FR). Each column separate stars by their distances, as indicated in the top panel. The adopted position of the TAMS for each luminosity range is included with a vertical dashed line (see Sect. 4.1). The bottom row of subpanels displays the corresponding cumulative distribution function following the color code of the histograms.
Current usage metrics show cumulative count of Article Views (full-text article views including HTML views, PDF and ePub downloads, according to the available data) and Abstracts Views on Vision4Press platform.
Data correspond to usage on the plateform after 2015. The current usage metrics is available 48-96 hours after online publication and is updated daily on week days.
Initial download of the metrics may take a while.