Fig. 2.
Download original image
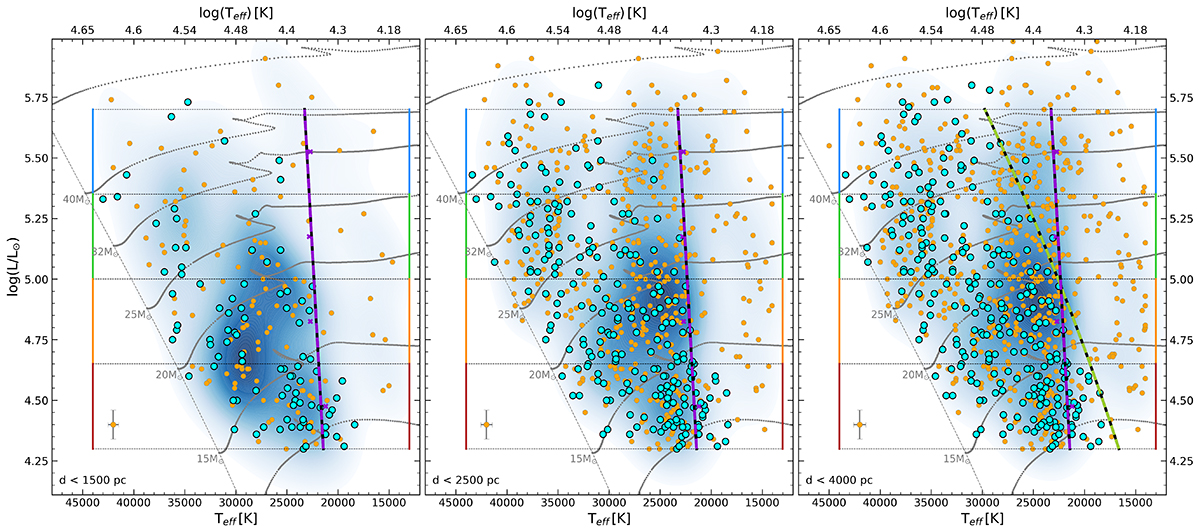
Hertzsprung-Russell diagrams showing the stars in our sample. From left to right, each panel limits the sample to stars within 1500 (221 stars), 2500 (670 stars), and 4000 pc (852 stars) of distance, respectively. The stars with v sin i > 100 km s−1 are indicated with cyan circles, whereas the rest are shown in orange. The average uncertainties are indicated with error bars in the lower-left corner of the panels. Each panel displays four luminosity ranges included for easier interpretation of the other figures. Our proposed location for the TAMS is marked with a purple line in all panels (see Fig. 3 and Sect. 4.1). The evolutionary tracks are taken from the MIST web-tool for solar metallicity and no initial rotation. The dashed green line on the right panel corresponds to a second-order polynomial fit of the points in the tracks where vcrit reaches 220 km s−1. A contour density mesh based on a Gaussian kernel is included to represent the density of points.
Fig. 3.
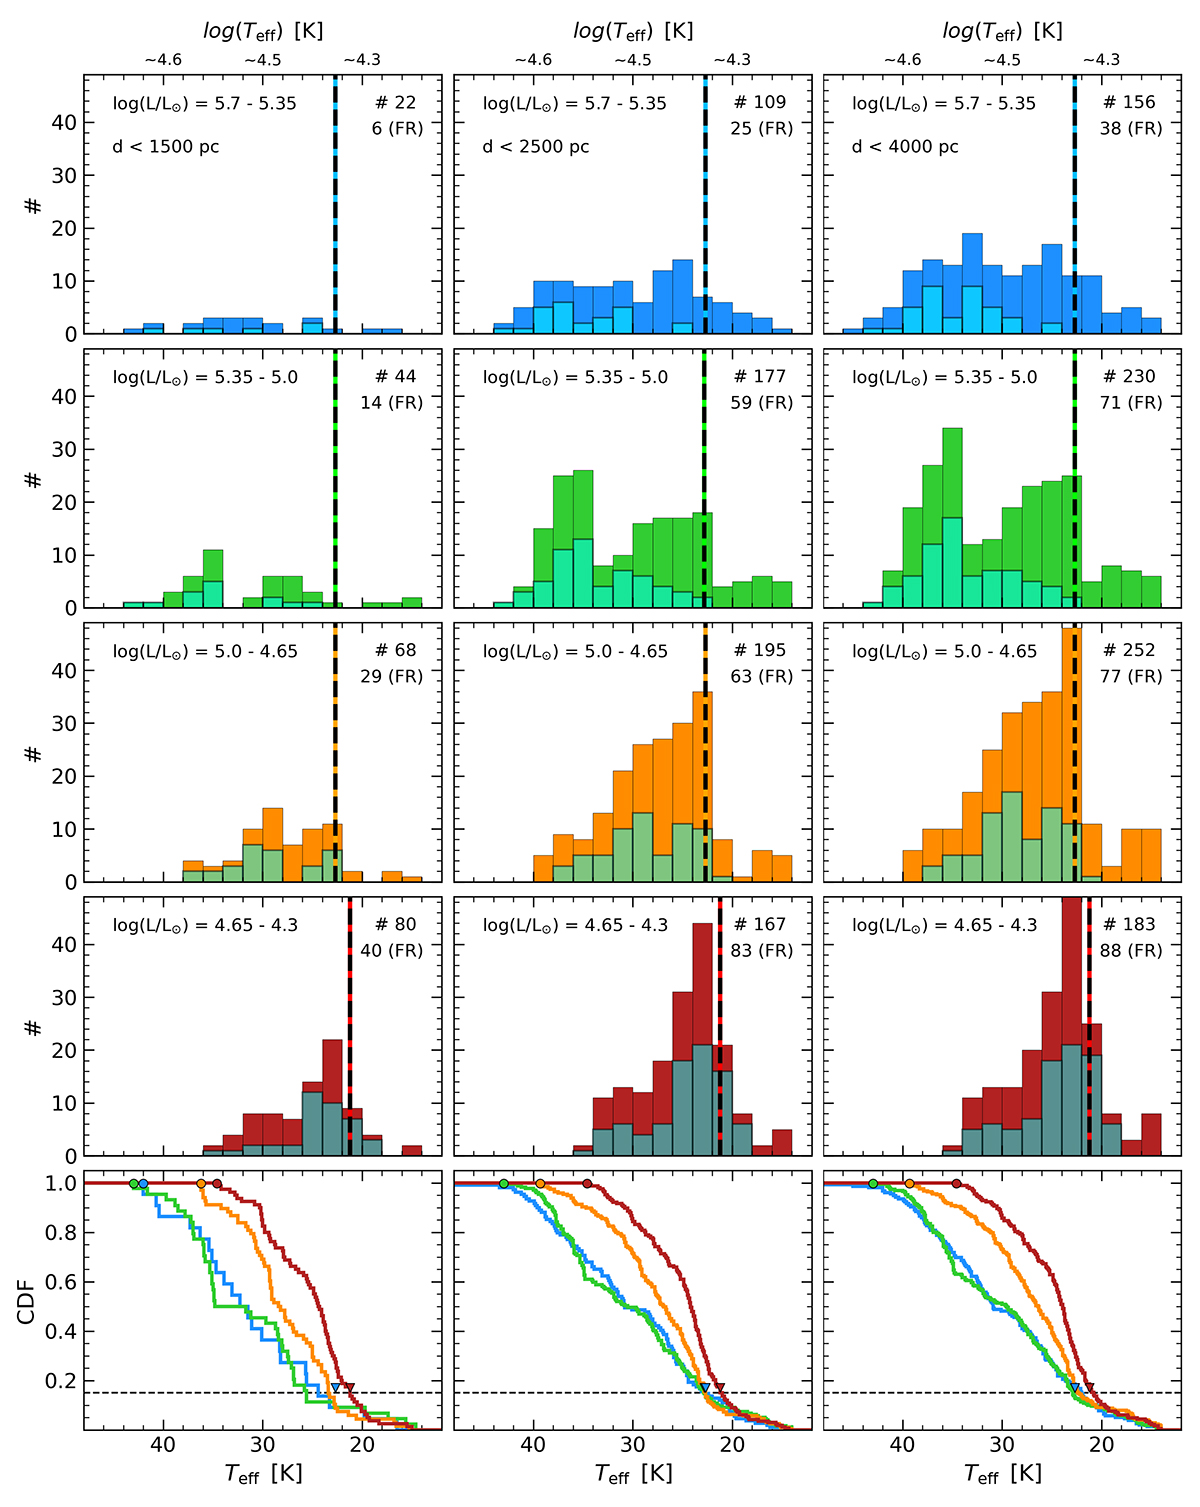
Number of stars with respect to their effective temperature. The histograms in the top four rows of subpanels separate stars within the indicated range of luminosities using different colors. Cyan bins indicate fast-rotating stars with v sin i > 100 km s−1. Each histogram displays the total number of stars and of fast-rotating objects (FR). Each column separate stars by their distances, as indicated in the top panel. The adopted position of the TAMS for each luminosity range is included with a vertical dashed line (see Sect. 4.1). The bottom row of subpanels displays the corresponding cumulative distribution function following the color code of the histograms.

Current usage metrics show cumulative count of Article Views (full-text article views including HTML views, PDF and ePub downloads, according to the available data) and Abstracts Views on Vision4Press platform.
Data correspond to usage on the plateform after 2015. The current usage metrics is available 48-96 hours after online publication and is updated daily on week days.
Initial download of the metrics may take a while.