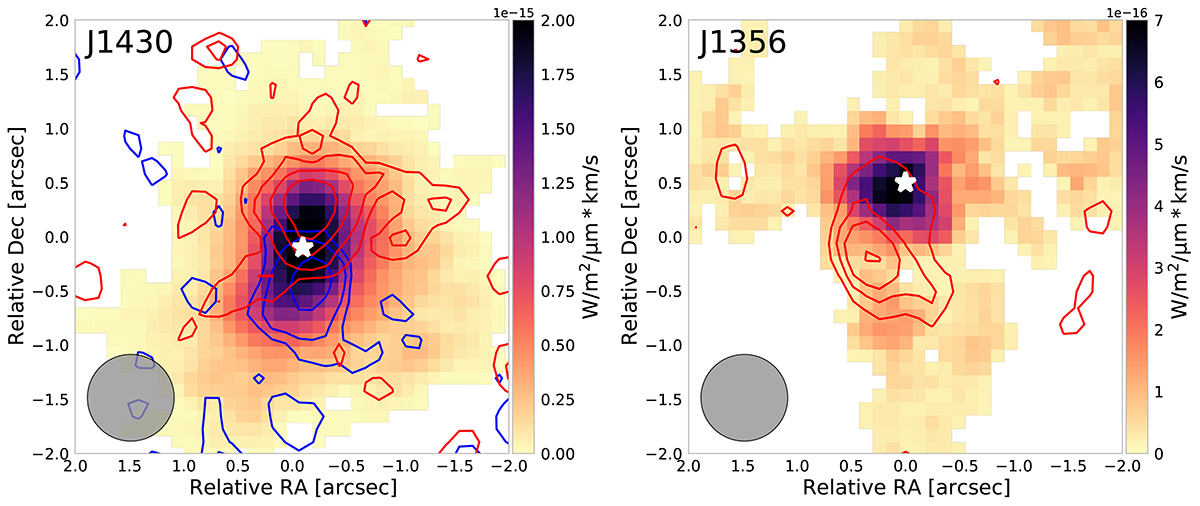
Fig. 8.
Download original image
Intensity maps of the high velocity components of the H21-0S(1) emission. The color map corresponds to the moment 0 of the total H21-0S(1) emission, while the contributions from high velocities are shown as red and blue contours. The spatial resolution of the SINFONI data is indicated with a gray ellipse in the bottom left corner. The white stars mark the peak of the near-infrared continuum as in Figure 4. Left panel: the red and blue contours of J1430 refer to velocities above ∼370 km s−1 with σred = 2.5 10−17 W/m2/μm.km s−1 and σblue = 2.7 10−17 W/m2/μm.km s−1. The red and blue contours are drawn at (2, 3,5, 7)σ. Right panel: the red contours of J1356 refer to velocities above ∼270 km s−1 with σred = 4.4 10−17 W/m2/μm.km s−1. The red contours are drawn at (2, 3, 4, 6)σ.
Current usage metrics show cumulative count of Article Views (full-text article views including HTML views, PDF and ePub downloads, according to the available data) and Abstracts Views on Vision4Press platform.
Data correspond to usage on the plateform after 2015. The current usage metrics is available 48-96 hours after online publication and is updated daily on week days.
Initial download of the metrics may take a while.