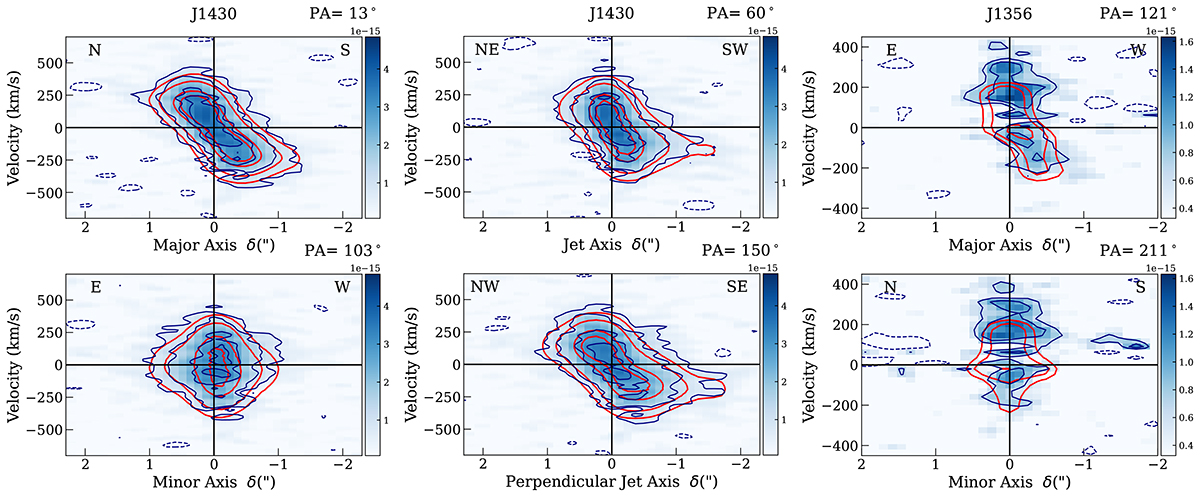
Fig. 7.
Download original image
PVDs extracted from the H21-0S(1) emission line data cubes. The blue contours trace the H21-0S(1) emission in SINFONI data cube, while the red contours trace the corresponding 3DBAROLO model. Left panels show the PVDs along the kinematic major (PA = 13°, top) and minor axis (PA = 103°, bottom) in J1430. Middle panels show the PVDs along (PA = 60°, top) and perpendicular (PA = 150°, bottom) to the radio jet direction in J1430. In the left and middle panels the blue and red contours are drawn at (2, 4, 8, 10)σ with σ = 3.23 10−19 W/m2/μm. Right panels: PVDs along the kinematic major (PA = 121°, top) and minor axis (PA = 211°, bottom) in J1356. The blue and red contours are drawn at (2, 3, 5)σ with σ = 3.26 10−19 W/m2/μm. All the PVDs were extracted using a slit of width 0.8″.
Current usage metrics show cumulative count of Article Views (full-text article views including HTML views, PDF and ePub downloads, according to the available data) and Abstracts Views on Vision4Press platform.
Data correspond to usage on the plateform after 2015. The current usage metrics is available 48-96 hours after online publication and is updated daily on week days.
Initial download of the metrics may take a while.