Fig. 5.
Download original image
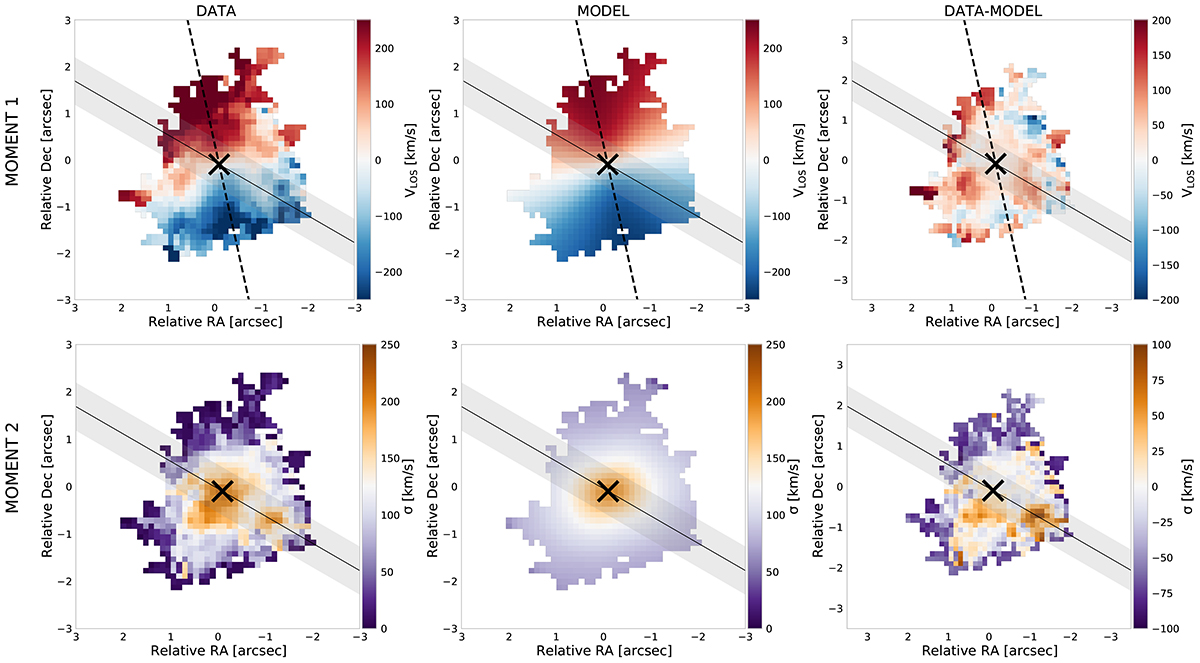
H21-0S(1) moment 1 and 2 maps (i.e., velocity and velocity dispersion) of the Teacup. The 3DBAROLO models of the moment 1 and 2 maps and the corresponding residuals are also shown. Regions below 2σ are masked out. The black cross mark the peak of the near-infrared continuum as in Figure 4. The kinematic major axis is shown as a black dashed line in the moment 1 maps. The PAjet = 60° is indicated as a black solid line and gray shaded area. The maps have been smoothed using a two-spaxel boxcar for presentation purposes. North is up and east to the left.
Current usage metrics show cumulative count of Article Views (full-text article views including HTML views, PDF and ePub downloads, according to the available data) and Abstracts Views on Vision4Press platform.
Data correspond to usage on the plateform after 2015. The current usage metrics is available 48-96 hours after online publication and is updated daily on week days.
Initial download of the metrics may take a while.