Open Access
Fig. 4.
Download original image
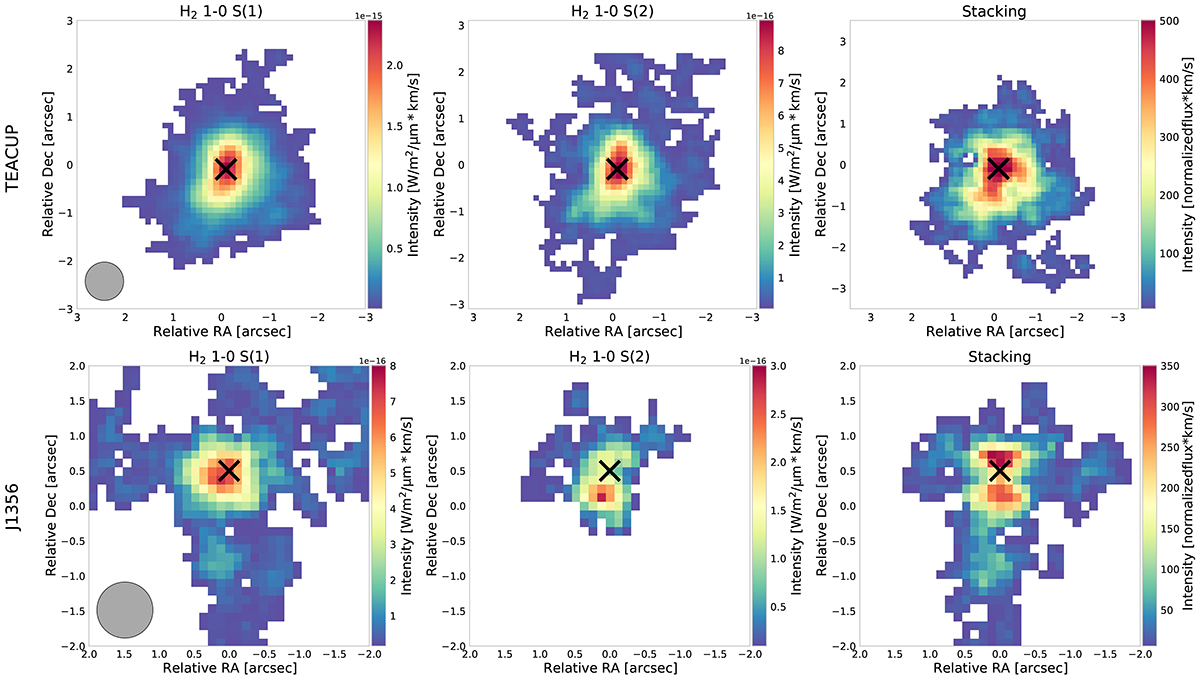
Integrated intensity (i.e., moment 0) maps of the H21-0S(1), S(2), and stacked H2 of J1430 (top panels) and of J1356 (bottom panels). The black cross marks the peak of the near-infrared continuum. The maps have been smoothed using a two-spaxel boxcar for presentation purposes. Regions below 2σ are masked out.
Current usage metrics show cumulative count of Article Views (full-text article views including HTML views, PDF and ePub downloads, according to the available data) and Abstracts Views on Vision4Press platform.
Data correspond to usage on the plateform after 2015. The current usage metrics is available 48-96 hours after online publication and is updated daily on week days.
Initial download of the metrics may take a while.