Fig. 2.
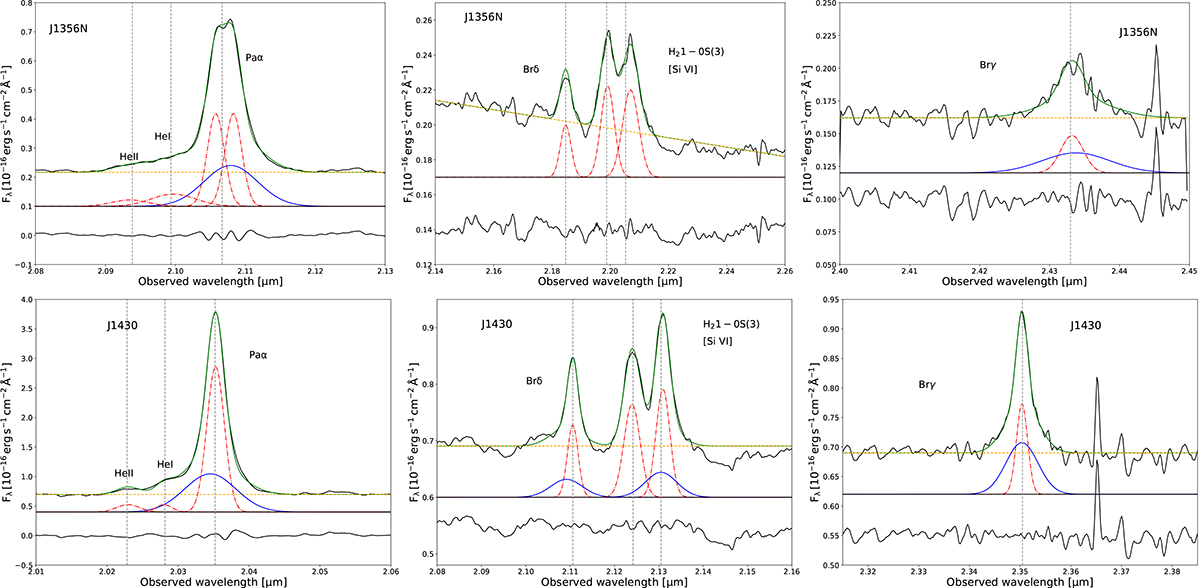
Download original image
Line profiles showing the nuclear spectra of J1356N (top panels) and the Teacup (bottom panels), extracted in a circular aperture of 0.8″ diameter and smoothed using a 3 pixel boxcar. The corresponding fits are shown as solid green lines. Solid blue and dot-dashed red Gaussians are the broad- and narrow- line components, respectively, and the orange dashed line is the continuum. The Gaussians have been vertically shifted for displaying purposes. The insets at the bottom of each panel are the residuals. The gray dotted vertical lines mark the expected position of the line peaks according to the redshift of the QSO2s.
Current usage metrics show cumulative count of Article Views (full-text article views including HTML views, PDF and ePub downloads, according to the available data) and Abstracts Views on Vision4Press platform.
Data correspond to usage on the plateform after 2015. The current usage metrics is available 48-96 hours after online publication and is updated daily on week days.
Initial download of the metrics may take a while.