Open Access
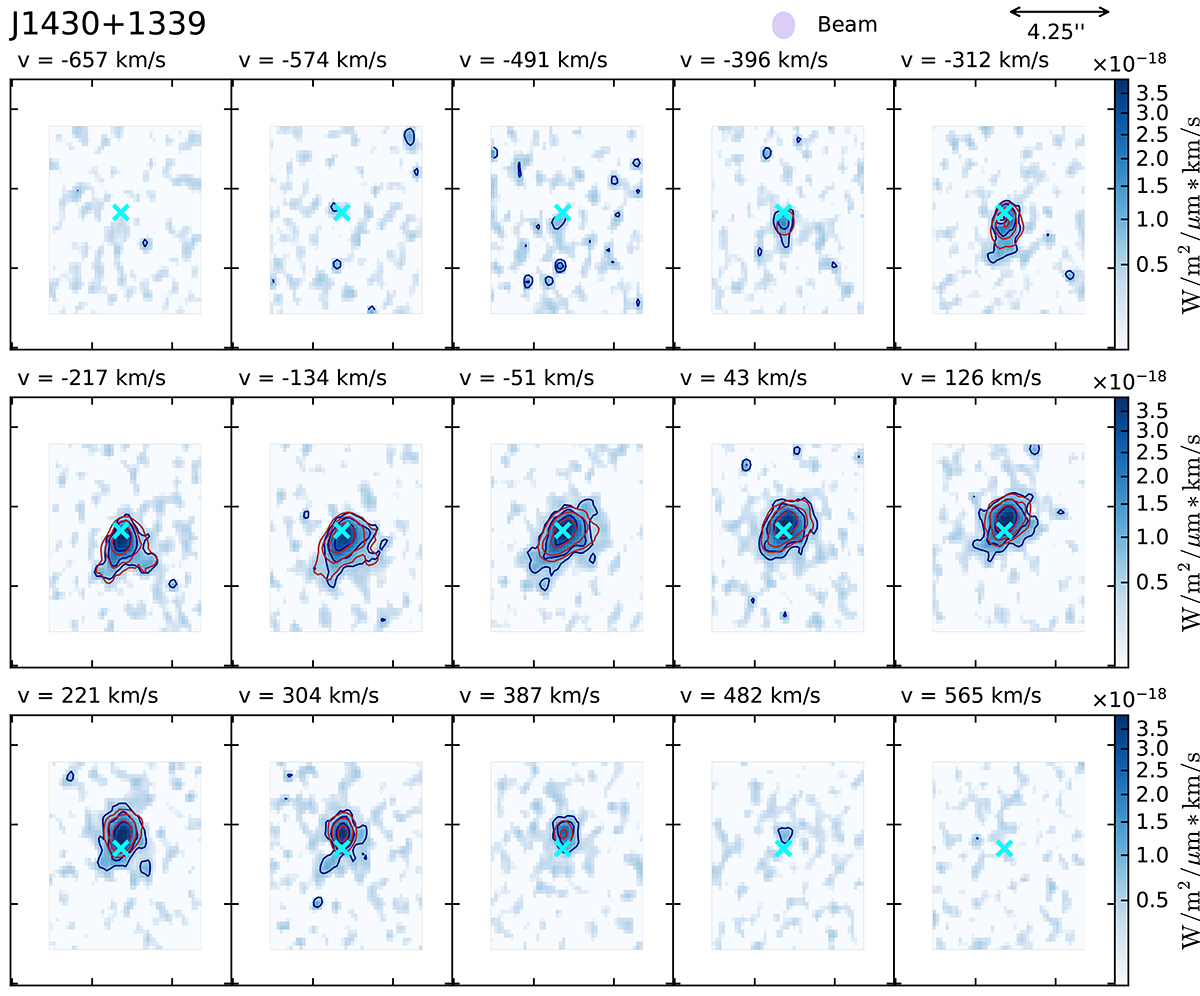
Fig. B.2.
Download original image
Channel maps of the H21-0S(1) emission line of J1430. Color scale maps and blue contours trace the emission in SINFONI data cube while red contours trace the emission in the 3DBAROLO model cube. Contours are drawn at (2, 4, 8, 16)σ.
Current usage metrics show cumulative count of Article Views (full-text article views including HTML views, PDF and ePub downloads, according to the available data) and Abstracts Views on Vision4Press platform.
Data correspond to usage on the plateform after 2015. The current usage metrics is available 48-96 hours after online publication and is updated daily on week days.
Initial download of the metrics may take a while.