Fig. 9.
Download original image
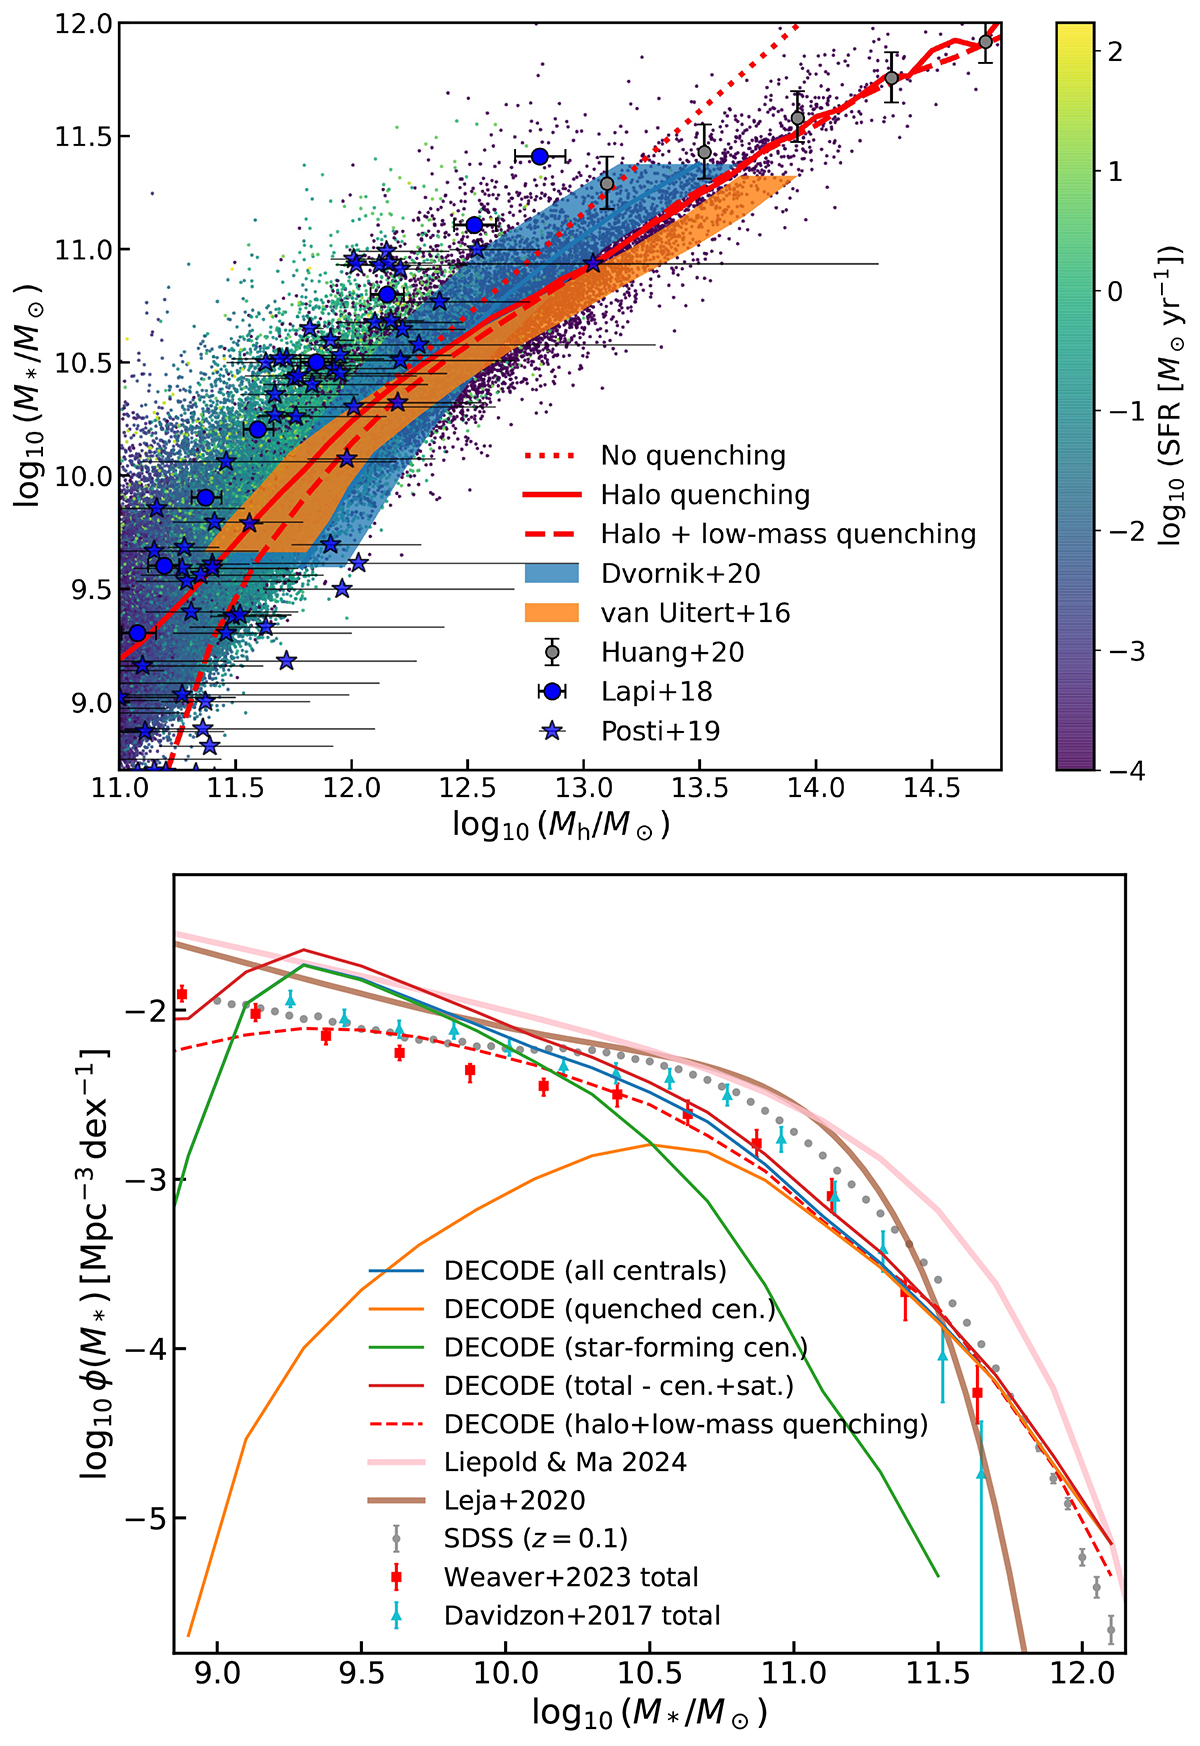
Upper panel: Same as Fig. 8 at redshift z = 0 with comparison to observations. The predictions of DECODE are compared to the stellar mass-halo mass relation from weak lensing determinations at low redshifts from van Uitert et al. (2016) (orange shaded area), Dvornik et al. (2020) (blue shaded area) and Huang et al. (2020) (grey dots with error bars), as well as the local spiral galaxies data from Lapi et al. (2018b) (blue dots with error bars) and Posti et al. (2019) (blue stars with error bars). Lower panel: Stellar mass function predicted by DECODE at redshift z = 0. The blue, orange, and green lines show the stellar mass function for all galaxies, quenched galaxies and star-forming central galaxies. The red solid lines show the total stellar mass function inclusive of the population of satellite galaxies. The red dashed lines show the case where low-mass quenching is included (Sect. 4.2.1). The brown solid line shows the 3D-HST+COSMOS data (Leja et al. 2020) and the pink solid line shows the determination from MASSIVE (Liepold & Ma 2024). The grey dots, red squares and cyan triangles with error bars show the observational total stellar mass functions from the SDSS at z = 0.1 (Bernardi et al. 2017), COSMOS2020 (Weaver et al. 2023) and COSMOS2015 (Davidzon et al. 2017) surveys.
Current usage metrics show cumulative count of Article Views (full-text article views including HTML views, PDF and ePub downloads, according to the available data) and Abstracts Views on Vision4Press platform.
Data correspond to usage on the plateform after 2015. The current usage metrics is available 48-96 hours after online publication and is updated daily on week days.
Initial download of the metrics may take a while.