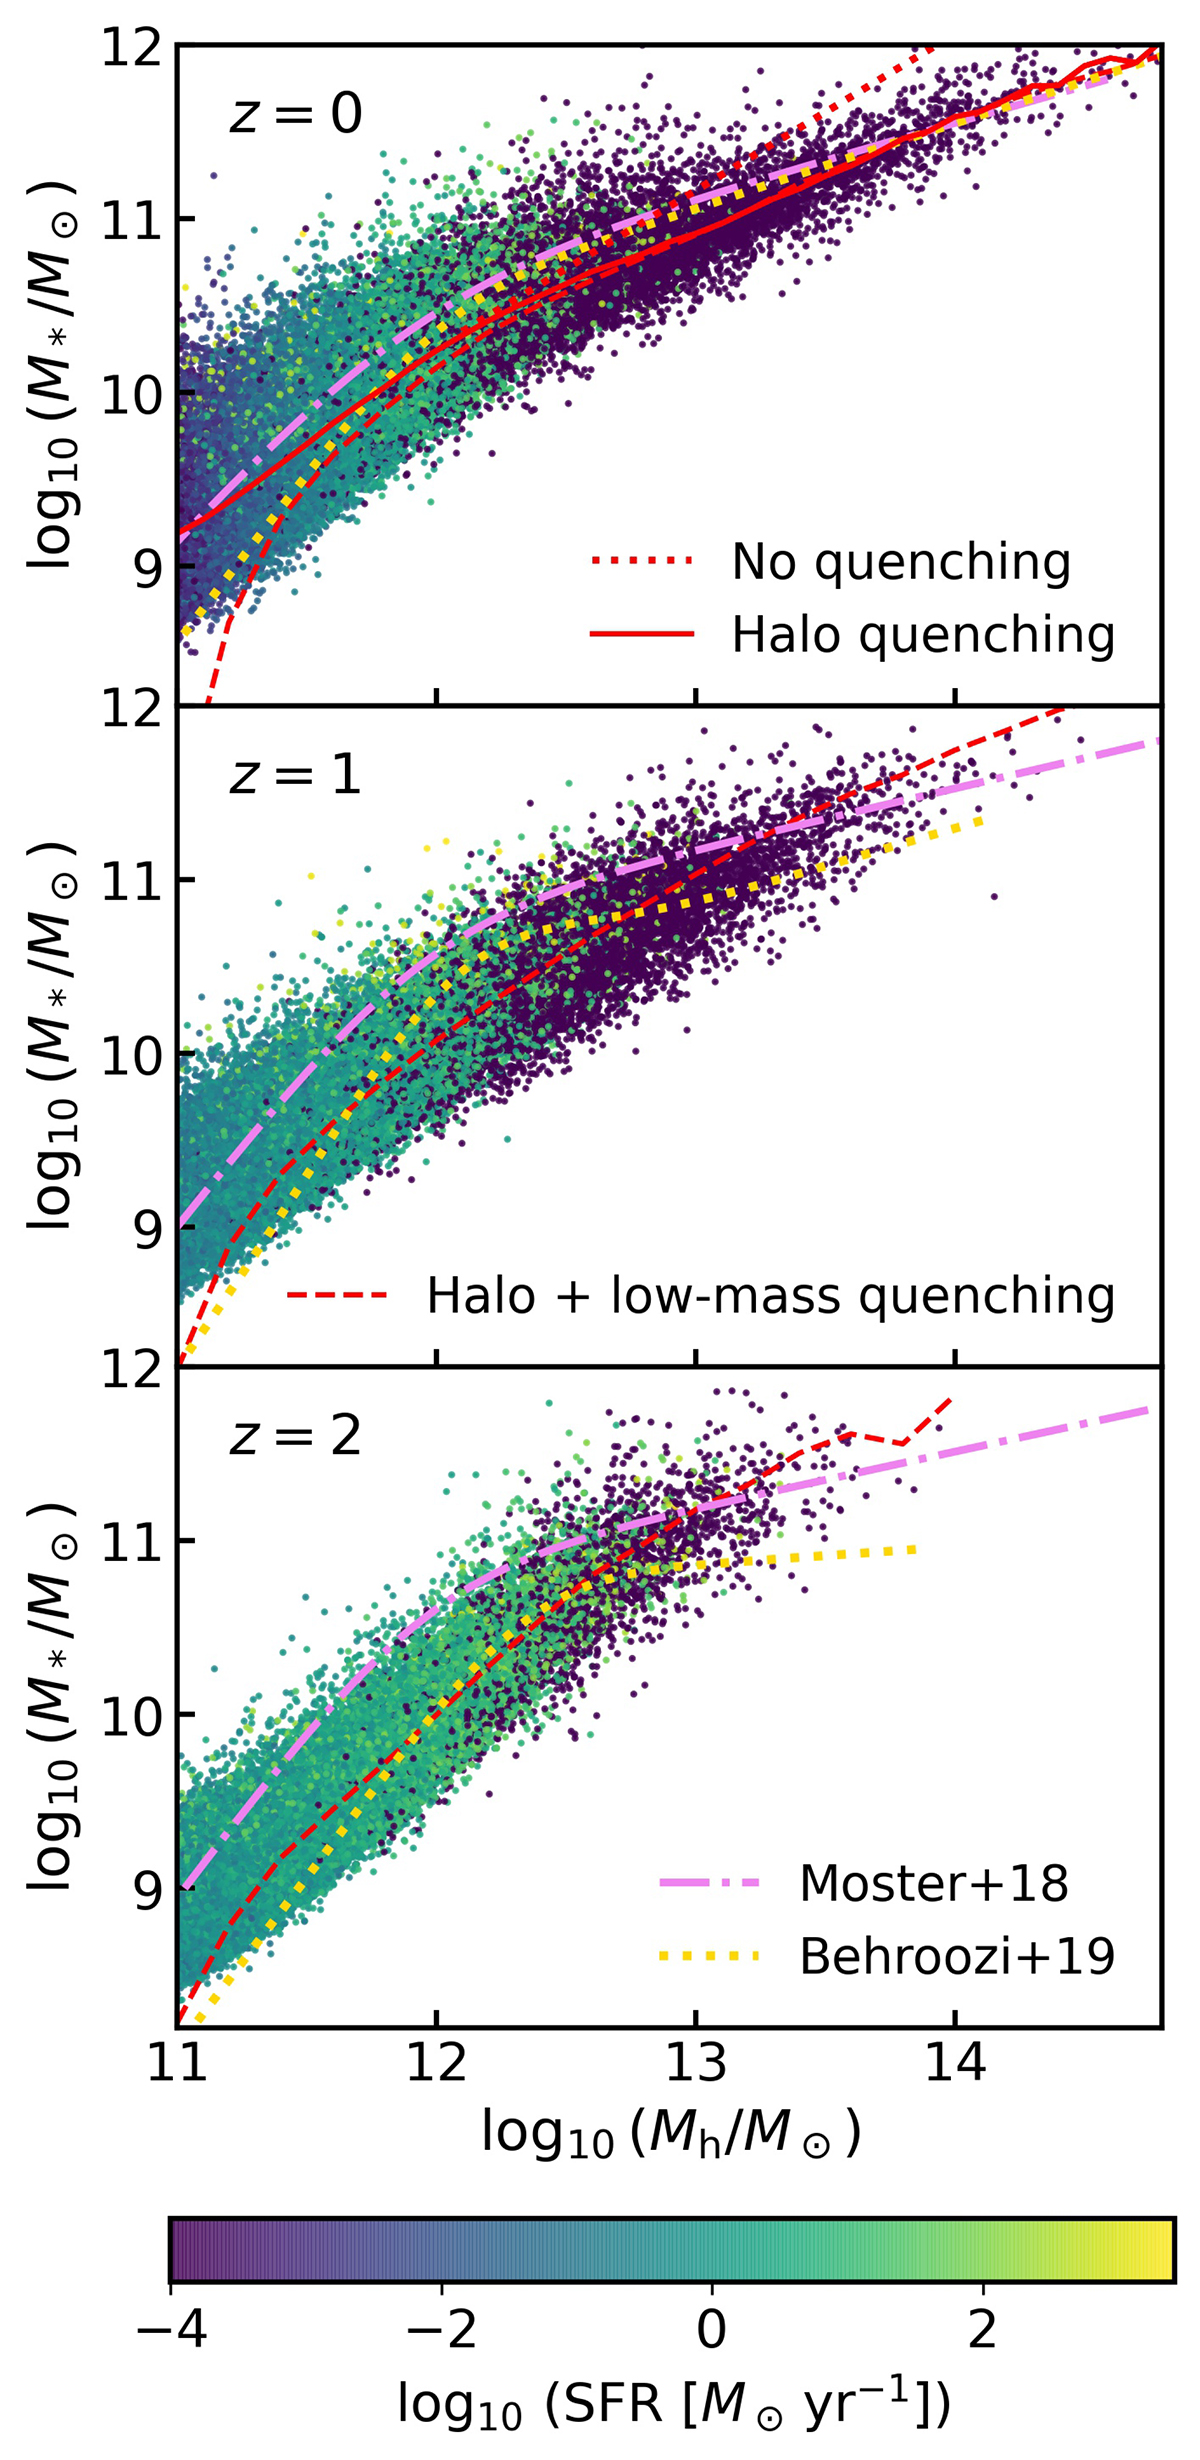
Fig. 8.
Download original image
Distribution of the galaxies in DECODE’s catalogue on the M⋆ − Mh plane at redshifts z = 0, 1 and 2, for the halo quenching scenario. The colour bar represents the star formation rate of the galaxies. The red dotted, solid and dashed lines show the scenarios with no quenching, halo quenching-only, and both halo and low-mass quenching, respectively. We also show the stellar mass-halo mass relations from Moster et al. (2018) (violet dash-dotted lines) and Behroozi et al. (2019) (yellow dotted lines), at the same redshifts.
Current usage metrics show cumulative count of Article Views (full-text article views including HTML views, PDF and ePub downloads, according to the available data) and Abstracts Views on Vision4Press platform.
Data correspond to usage on the plateform after 2015. The current usage metrics is available 48-96 hours after online publication and is updated daily on week days.
Initial download of the metrics may take a while.