Fig. 7.
Download original image
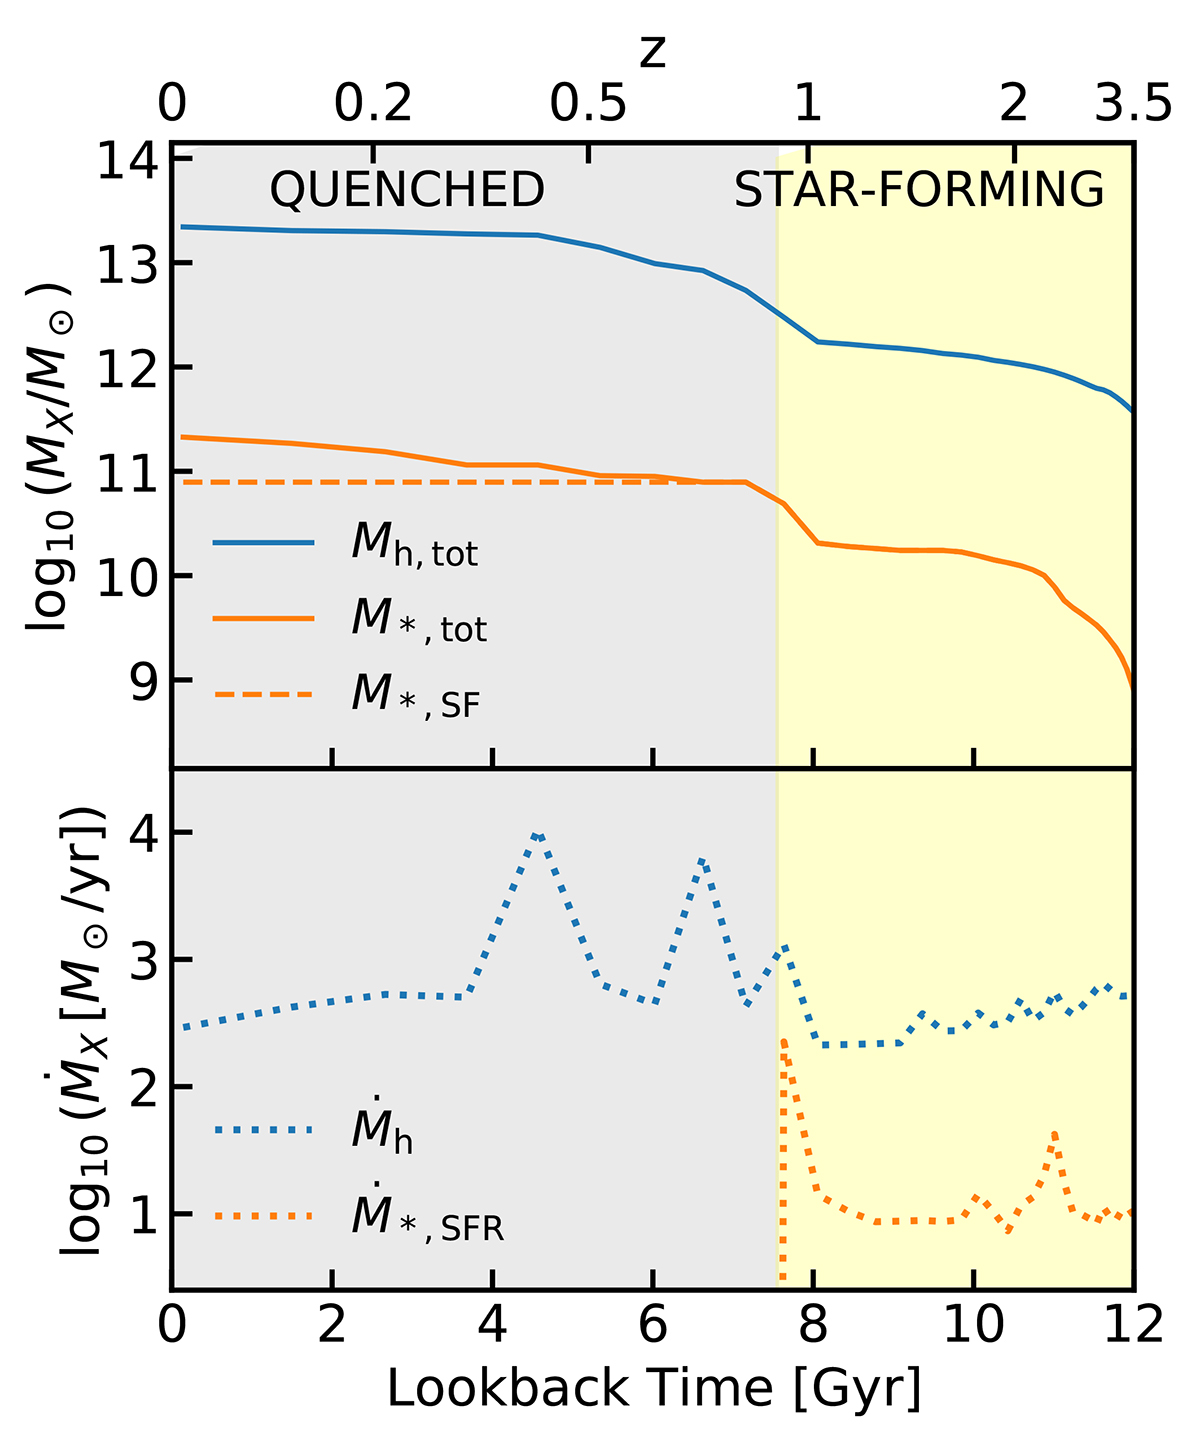
Example of evolution of a galaxy of stellar mass M⋆ ∼ 1011.5 M⊙ from the catalogue, for the case of halo quenching. The upper and lower panels show the evolution in mass and growth rate, respectively. The blue solid and dotted lines show the halo mass assembly and accretion rate history, respectively. The orange solid and dotted lines show the stellar mass growth and star formation rate, respectively. Additionally the orange dashed line shows the case of star formation-only without mergers. At redshift z ∼ 0.9, when the halo mass reaches the threshold value, the star formation rate drops and the galaxy is quenched.
Current usage metrics show cumulative count of Article Views (full-text article views including HTML views, PDF and ePub downloads, according to the available data) and Abstracts Views on Vision4Press platform.
Data correspond to usage on the plateform after 2015. The current usage metrics is available 48-96 hours after online publication and is updated daily on week days.
Initial download of the metrics may take a while.