Open Access
Fig. 4.
Download original image
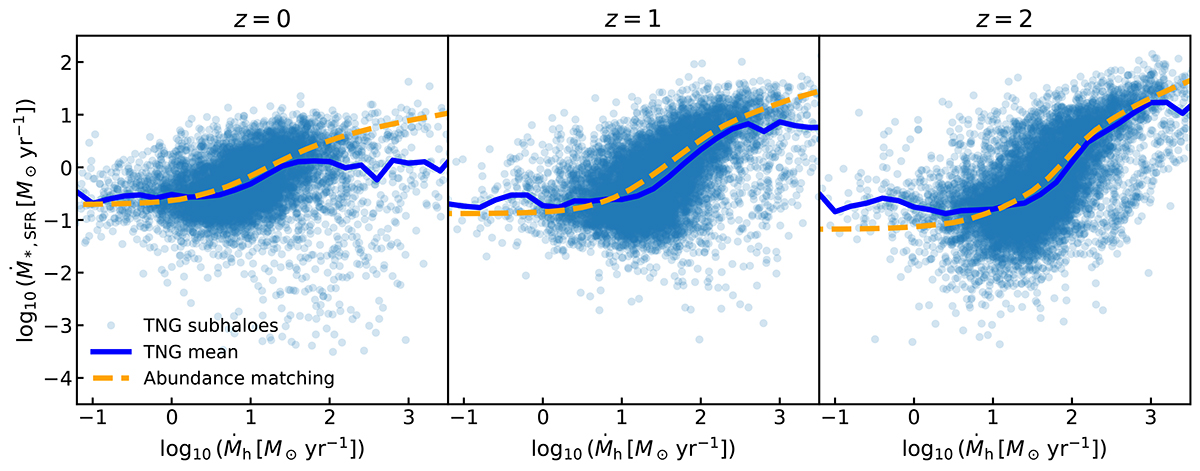
Distribution of the TNG central subhaloes/galaxies on the star formation rate-halo accretion rate plane (blue dots), and mean scaling relation from the TNG (blue lines) and computed using the TNG’s inputs via the abundance matching described in Sect. 2.2 (orange dashed lines) at redshifts 0, 1 and 2.
Current usage metrics show cumulative count of Article Views (full-text article views including HTML views, PDF and ePub downloads, according to the available data) and Abstracts Views on Vision4Press platform.
Data correspond to usage on the plateform after 2015. The current usage metrics is available 48-96 hours after online publication and is updated daily on week days.
Initial download of the metrics may take a while.