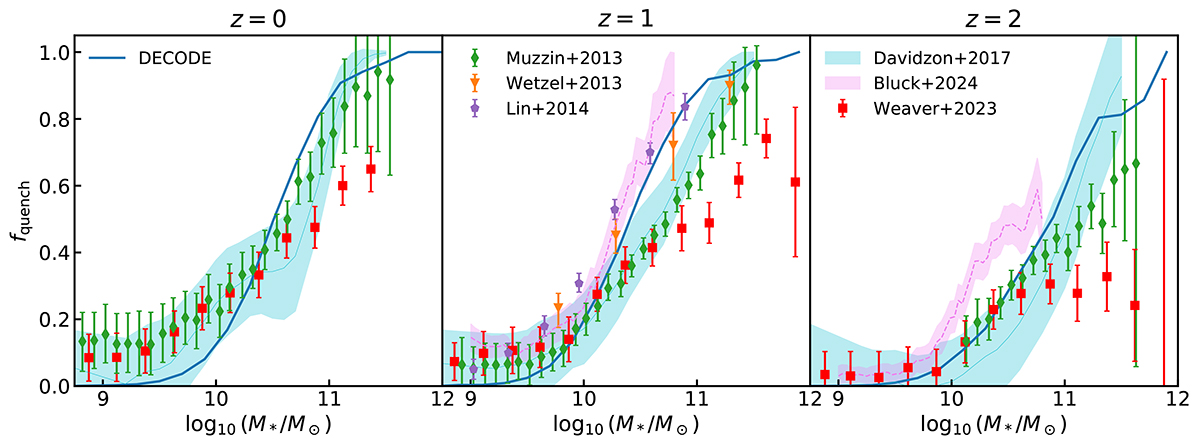
Fig. 10.
Download original image
Fraction of quenched galaxies as a function of stellar mass at redshifts in the same redshift bins. The predictions from DECODE are shown for central galaxies only (blue solid lines). We compare DECODE’s predictions with the observed quenched fractions from the COSMOS2015 (cyan solid lines and shaded areas; Davidzon et al. 2017) and COSMOS2020 (red squares with error bars; Weaver et al. 2023) surveys. Further data from Muzzin et al. (2013) (green rhombuses with error bars), Wetzel et al. (2013) (orange triangles with error bars), Lin et al. (2014) (purple pentagons with error bars), and Bluck et al. (2024) (JWST-CEERS at 1 < z < 2 and 2 < z < 4, violet dashed lines and shaded areas) are shown for comparison.
Current usage metrics show cumulative count of Article Views (full-text article views including HTML views, PDF and ePub downloads, according to the available data) and Abstracts Views on Vision4Press platform.
Data correspond to usage on the plateform after 2015. The current usage metrics is available 48-96 hours after online publication and is updated daily on week days.
Initial download of the metrics may take a while.