Fig. A.1
Download original image
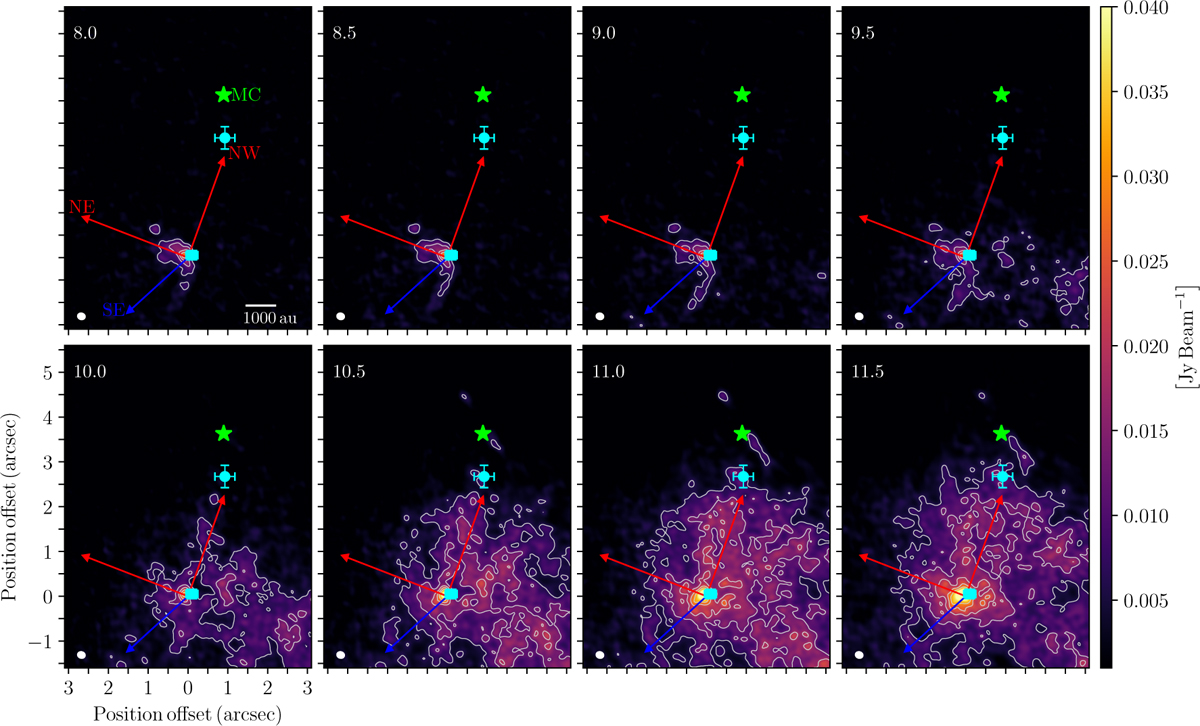
Blueshifted channel maps of the H2CO molecular line emission of the GGD 27–MM2(E) protostellar system. The channel velocity in km s−1 is indicated in the top-left corner. The contours start at 3σ and are in steps of 3σ, 6σ, 9σ, and 12σ, where σ = 2.1 mJy beam−1. The cyan dot and square mark the position of the CH3OH and H2O maser sources obtained from Kurtz et al. (2004) and Kurtz & Hofner (2005), respectively. The green star marks the position of the source MC taken from Qiu & Zhang (2009). The synthesized beam in all panels is shown in the lower-left corner. The two red arrows present the redshifted NE and NW CO outflow directions, and the blue arrow is the blueshifted SE CO outflow direction taken from Fernández-López et al. (2013).
Current usage metrics show cumulative count of Article Views (full-text article views including HTML views, PDF and ePub downloads, according to the available data) and Abstracts Views on Vision4Press platform.
Data correspond to usage on the plateform after 2015. The current usage metrics is available 48-96 hours after online publication and is updated daily on week days.
Initial download of the metrics may take a while.