Fig. 6
Download original image
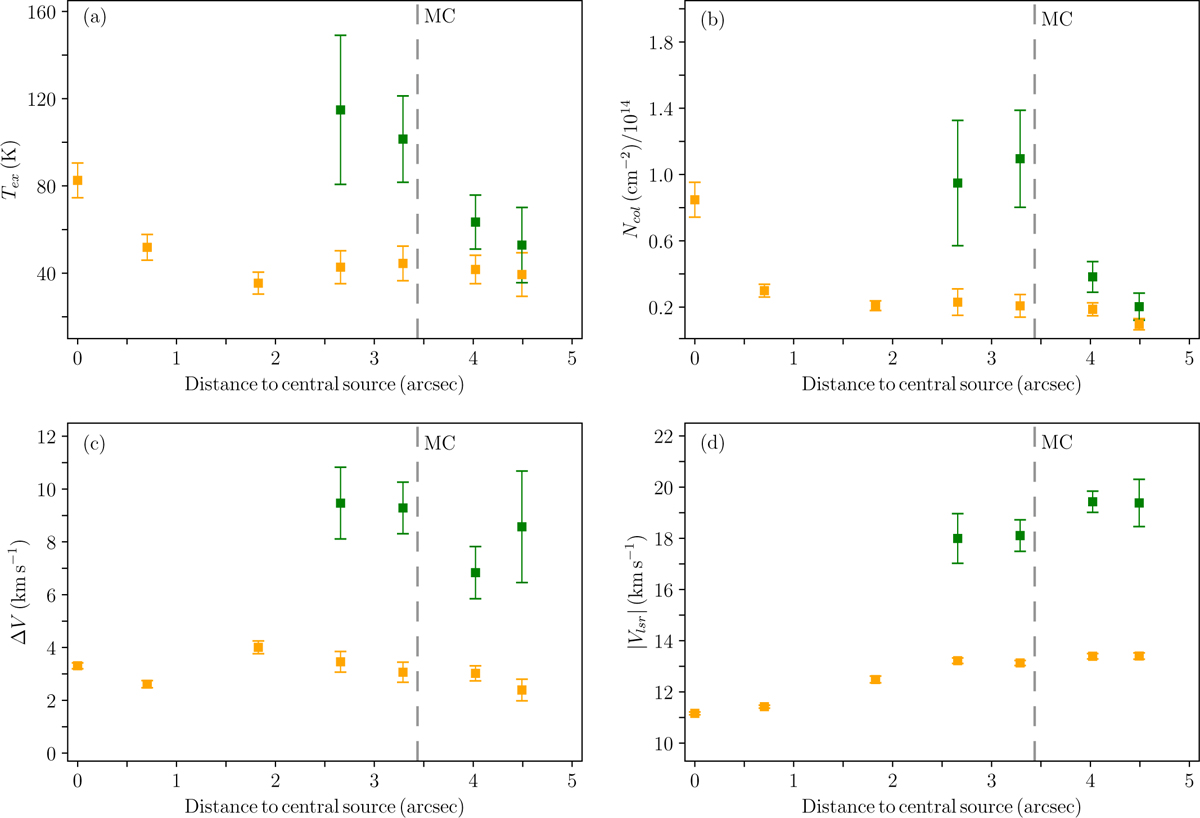
Physical conditions of the gas of the emission of CH3CN associated with the GGD 27-MM2(E) molecular outflow as a function of the distance to the central source. (a) Excitation temperature. (b) Column density. (c) Line width. (d) Velocity of the gas. Error bars are derived from the model (see the main text for more details). Orange and green squares show results from a simultaneous fitting of two kinematic components. The orange squares are probably associated with weak/mild shocks from the expanding outflow walls, whereas the green squares are possibly linked with a more violent shock between the fast wind and a dense cloudlet (MC source), whose position is marked by a dashed vertical line at about ![]() .
.
Current usage metrics show cumulative count of Article Views (full-text article views including HTML views, PDF and ePub downloads, according to the available data) and Abstracts Views on Vision4Press platform.
Data correspond to usage on the plateform after 2015. The current usage metrics is available 48-96 hours after online publication and is updated daily on week days.
Initial download of the metrics may take a while.