Fig. 5
Download original image
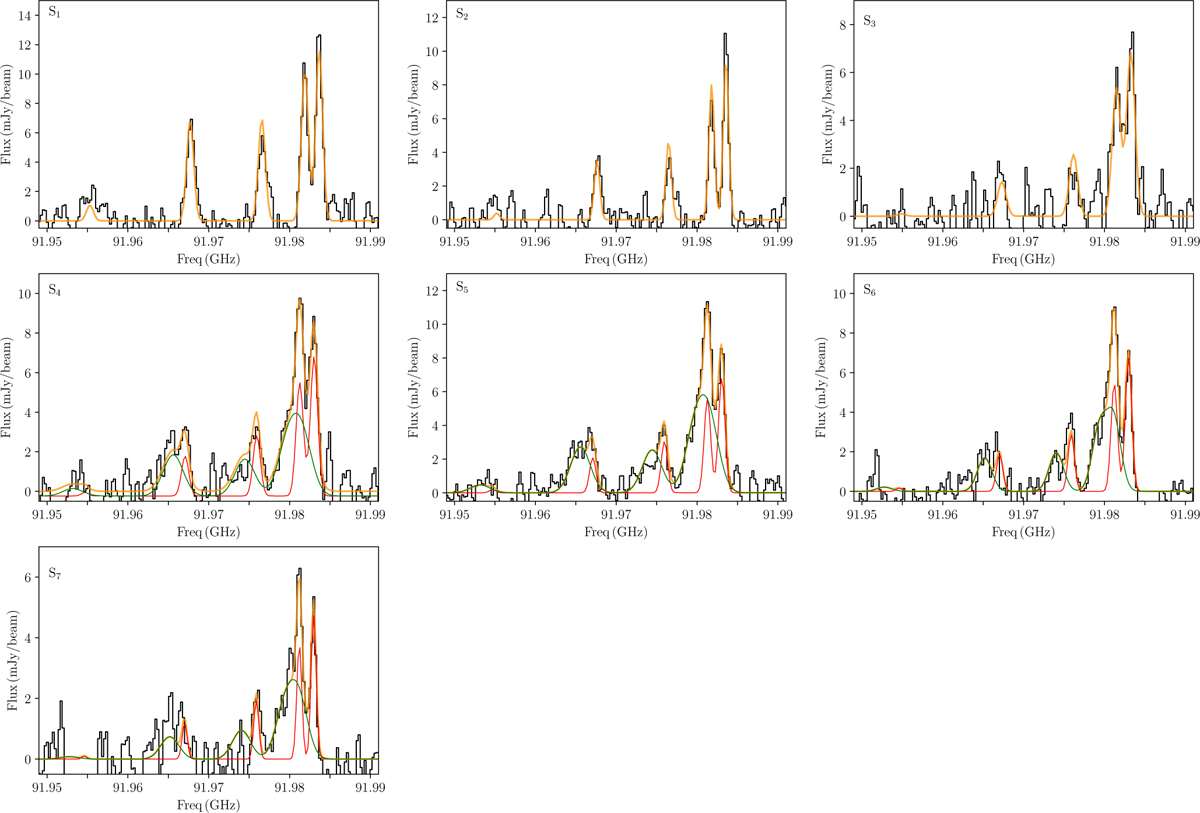
Extracted spectra of the CH3CN (5–4) K-ladder from the areas marked with blue dots in panel b of Fig. 2. The labels S 1 to S 7 indicate the location of the points, with S1 being the point over the MM2(E) and S7 the most distant point in the south-north direction. The black line represents the data obtained from the observations, and the orange line shows the best fit. For panels S1 to S3 we used only one velocity component for our fit, whereas for panels S4 to S7 we used two additional velocity components (green and red lines).
Current usage metrics show cumulative count of Article Views (full-text article views including HTML views, PDF and ePub downloads, according to the available data) and Abstracts Views on Vision4Press platform.
Data correspond to usage on the plateform after 2015. The current usage metrics is available 48-96 hours after online publication and is updated daily on week days.
Initial download of the metrics may take a while.