Fig. 2
Download original image
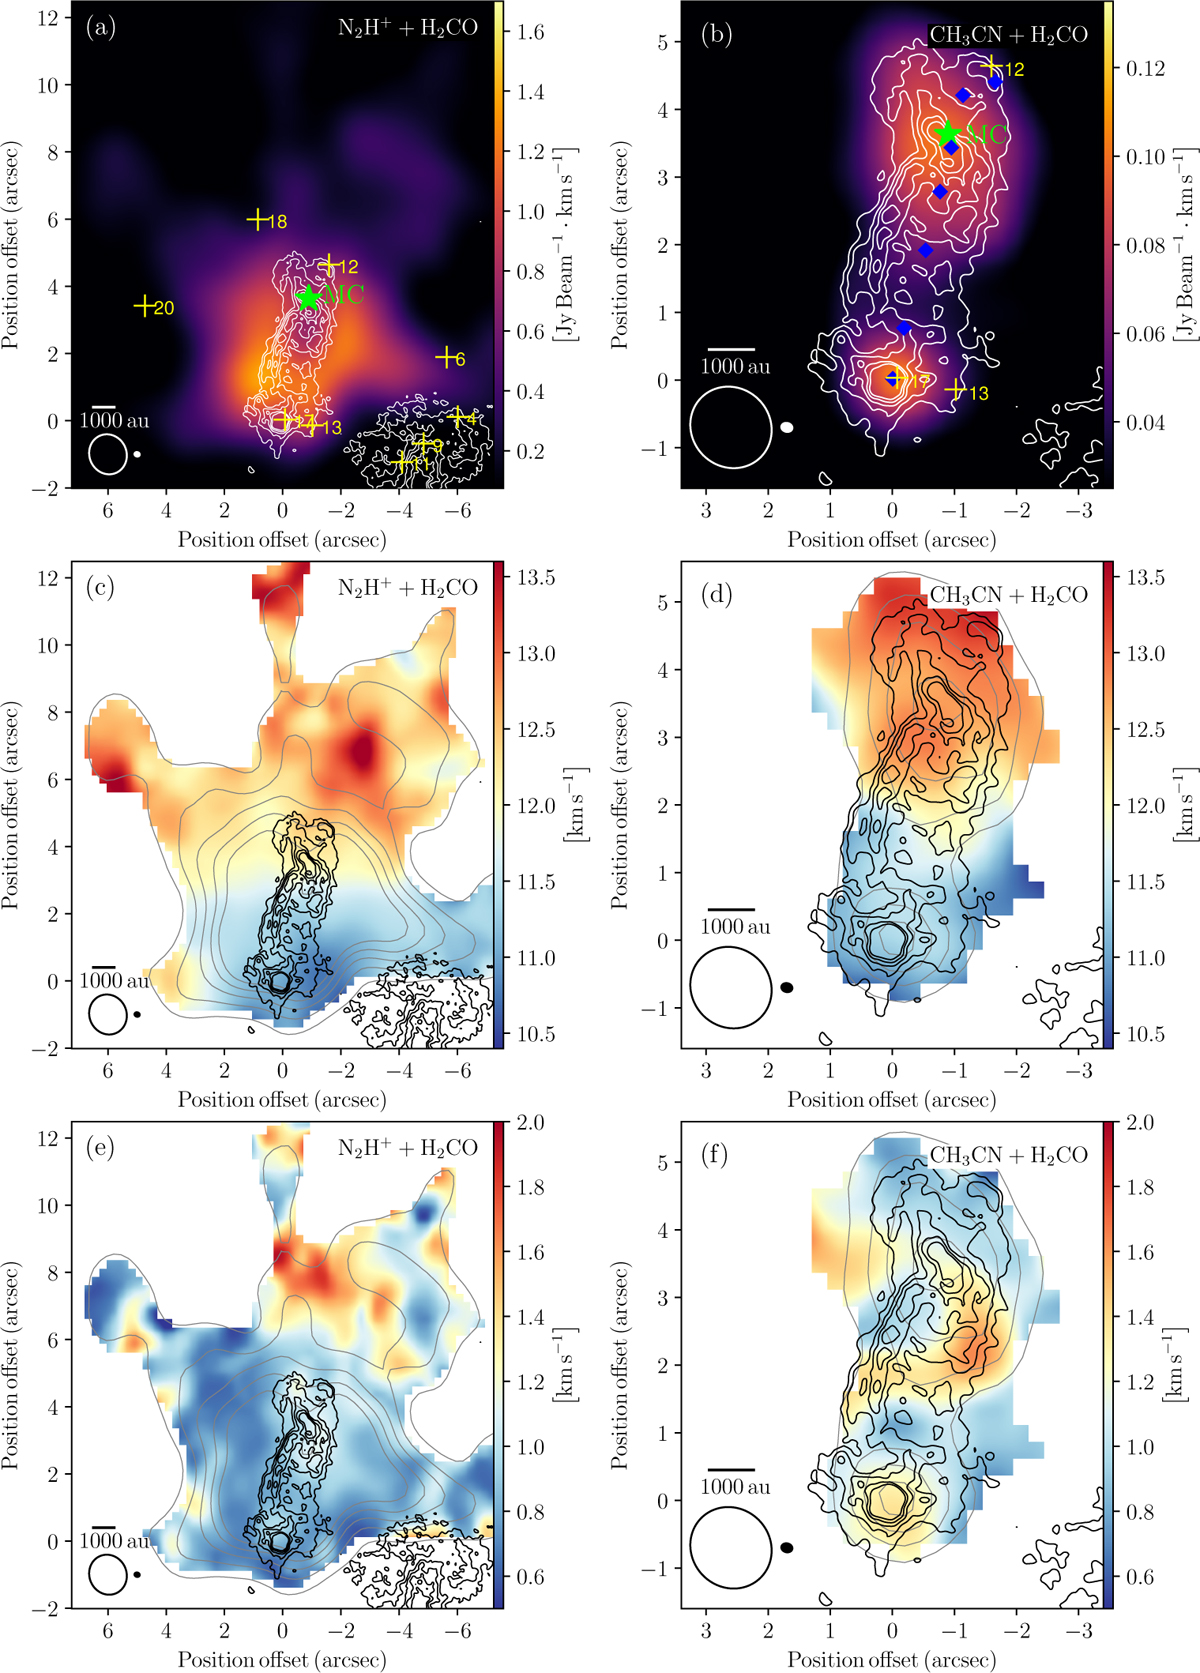
GGD 27-MM2 molecular line emission from N2H+, CH3CN, and H2CO molecular lines. (a) Intensity map of the N2H+. (b) Intensity map of the CH3CN. (c) Velocity map of the N2H+. (d) Velocity map of CH3CN. (e) Velocity dispersion map of the N2H+. (f) Velocity dispersion map of the CH3CN. The H2CO molecular line emission is depicted in all panels as white (panels a and b) and black (panels c–f) contours; the contours levels are the same as in Fig. 1. The gray contours are the intensity map of the emission of N2H+ (panels cand e) and CH3CN (panels d and f); the contours levels start from 5σ and are in steps of 5σ, 10σ, 15σ, and 20σ, where σ = 30.3 mJy beam−1 km s−1 for the N2H+ emission, and start from 5σ with steps of 3σ, 6σ, 9σ, and 12σ, where σ = 6.8 mJy beam−1 km s−1, for the CH3CN emission. The synthesized beams are shown in the lower-left corners. In panels a and b, a green star marks the position of the source MC taken from Qiu & Zhang (2009), and yellow crosses marks the positions of the continuum sources reported by Busquet et al. (2019). Blue diamonds in panel bindicate the positions where we have extracted the spectra of the CH3CN.
Current usage metrics show cumulative count of Article Views (full-text article views including HTML views, PDF and ePub downloads, according to the available data) and Abstracts Views on Vision4Press platform.
Data correspond to usage on the plateform after 2015. The current usage metrics is available 48-96 hours after online publication and is updated daily on week days.
Initial download of the metrics may take a while.