Fig. 1
Download original image
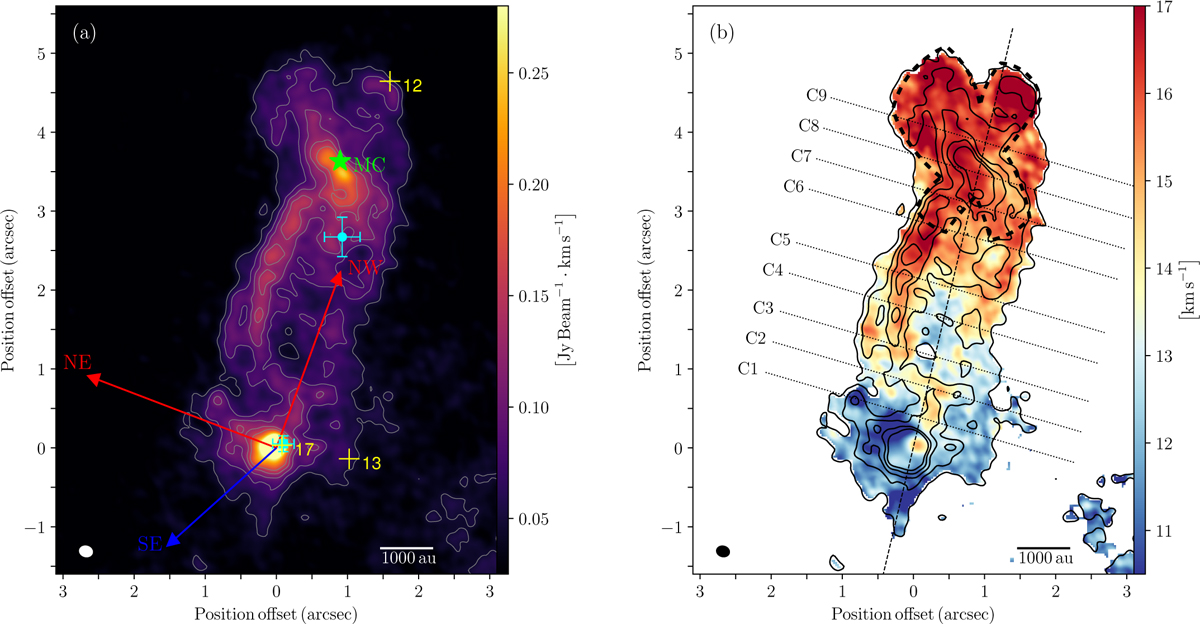
GGD 27–MM2(E) molecular line emission of H2CO. (a) ALMA moment zero or integrated intensity map. (b) ALMA first moment or intensity-weighted velocity map. The two red arrows represent the redshifted NE and NW CO outflow directions, while the blue arrow is the blueshifted SE CO outflow direction Fernández-López et al. (2013). Yellow crosses represent the position of the continuum sources reported by Busquet et al. (2019): sources 13 and 17 are MM2(W) and MM2(E), respectively. The cyan dot and square mark the position of the CH3OH and H2O maser sources obtained from Kurtz et al. (2004) and Kurtz & Hofner (2005), respectively. The green star represents the position of the source MC taken from Qiu & Zhang (2009). The dashed black X-shaped curve and the dashed black line in (b) outline the shocked region around the MC and the outflow axis, while the dotted lines labeled C1–C9 indicate the position where the PV diagram presented in Fig. 4 was extracted. The synthesized beam is shown in the lower-left corner. The contour levels in both panels start at 5σ and are in steps of 3σ, 6σ, 9σ, and 12σ, where σ = 9.5 mJy beam−1 km s−1.
Current usage metrics show cumulative count of Article Views (full-text article views including HTML views, PDF and ePub downloads, according to the available data) and Abstracts Views on Vision4Press platform.
Data correspond to usage on the plateform after 2015. The current usage metrics is available 48-96 hours after online publication and is updated daily on week days.
Initial download of the metrics may take a while.