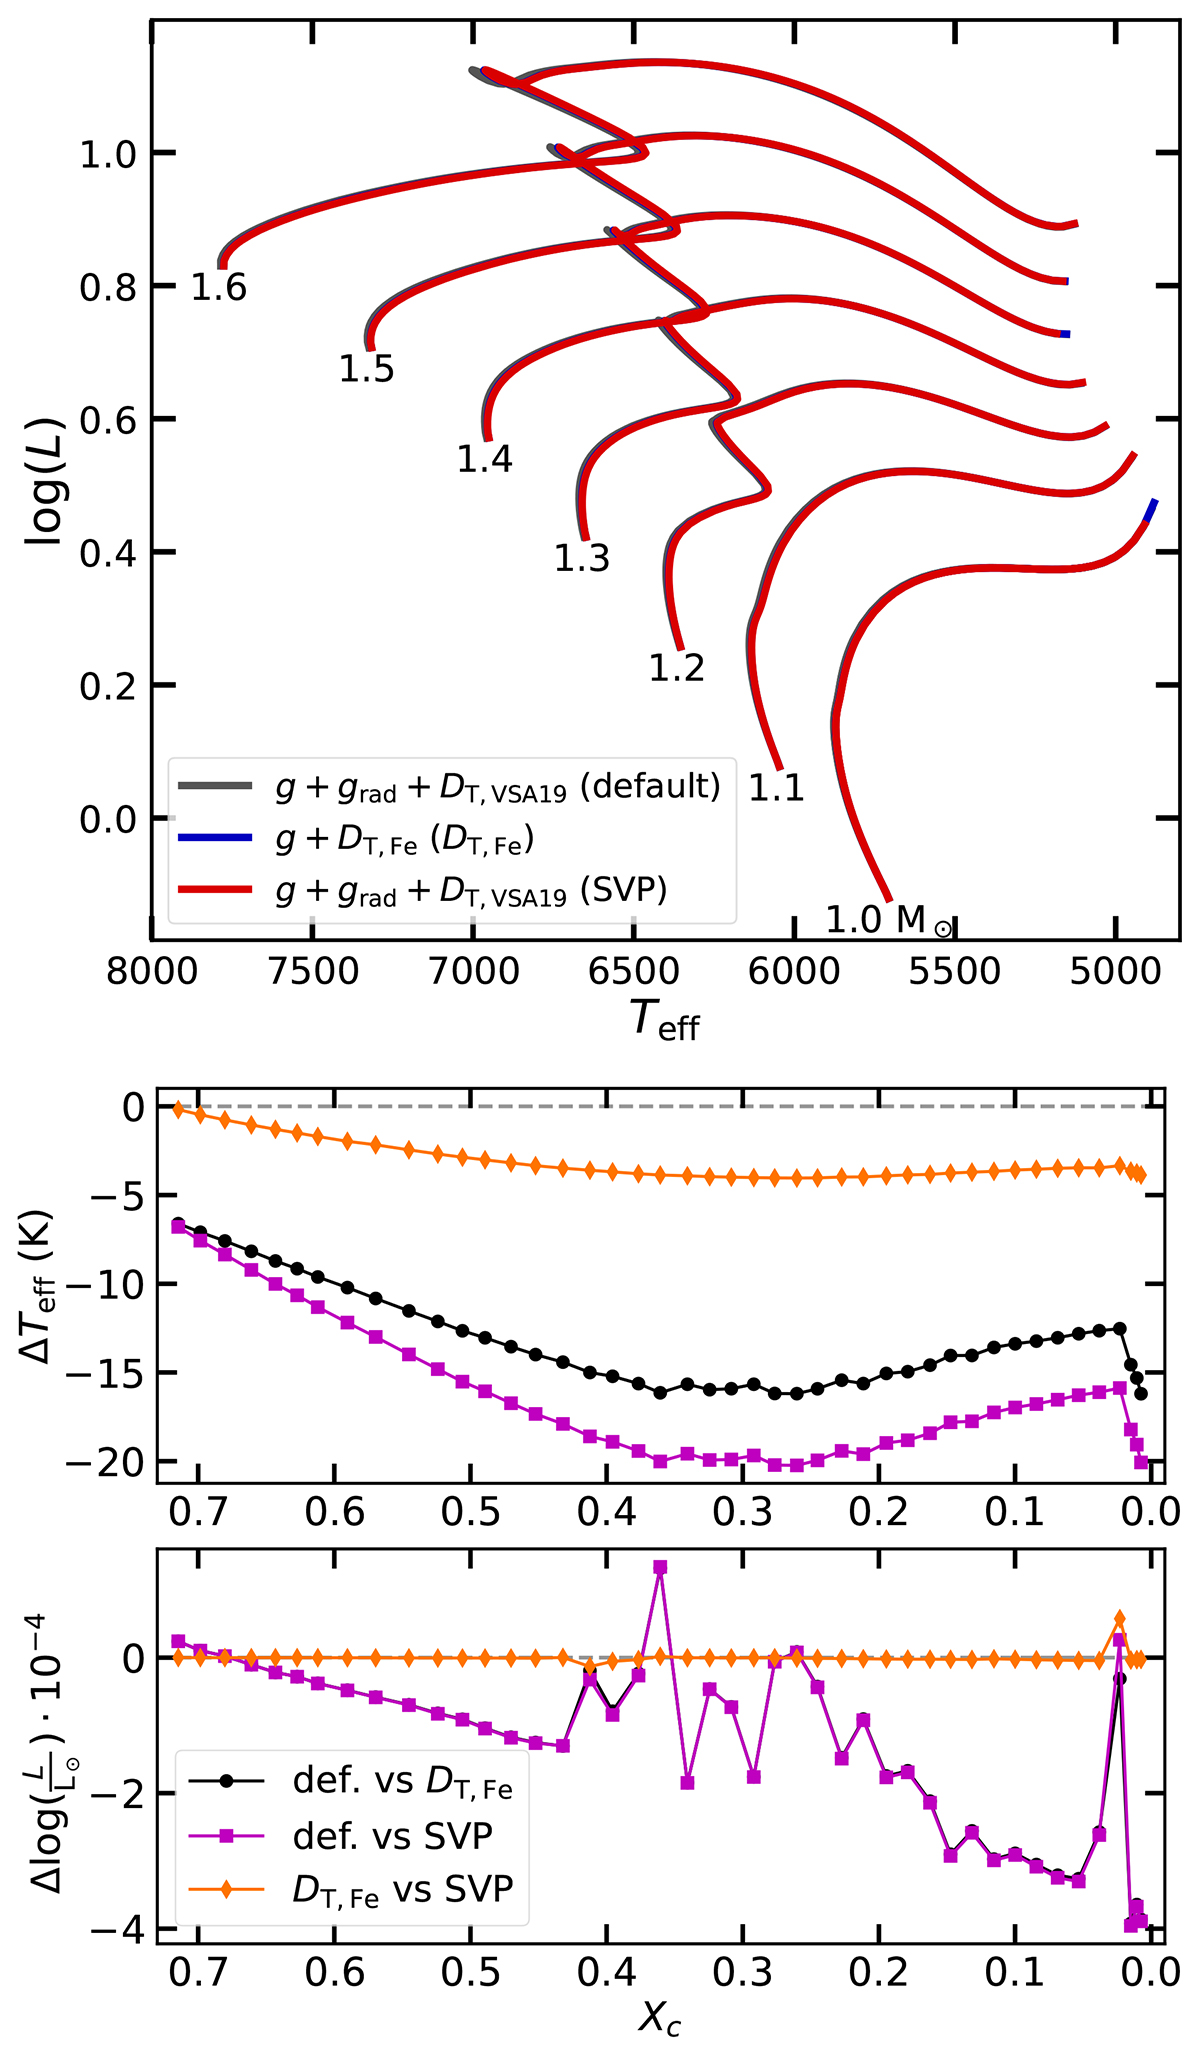
Fig. 1.
Download original image
Upper panel: HR diagram of different evolutionary tracks for the different radiative acceleration methods – the default method (gray line), models with DT, Fe (blue line), and the SVP method (red line). Lower panels: Difference for the 1.4 M⊙ models for the different methods, for effective temperature (middle panel) and luminosity (bottom panel) as a function of the central hydrogen mass fraction. The black circles are the differences between the default method and the DT, Fe, the purple squares the differences between the default method and the SVP method, and the orange diamonds the differences between DT, Fe and the SVP method.
Current usage metrics show cumulative count of Article Views (full-text article views including HTML views, PDF and ePub downloads, according to the available data) and Abstracts Views on Vision4Press platform.
Data correspond to usage on the plateform after 2015. The current usage metrics is available 48-96 hours after online publication and is updated daily on week days.
Initial download of the metrics may take a while.