Open Access
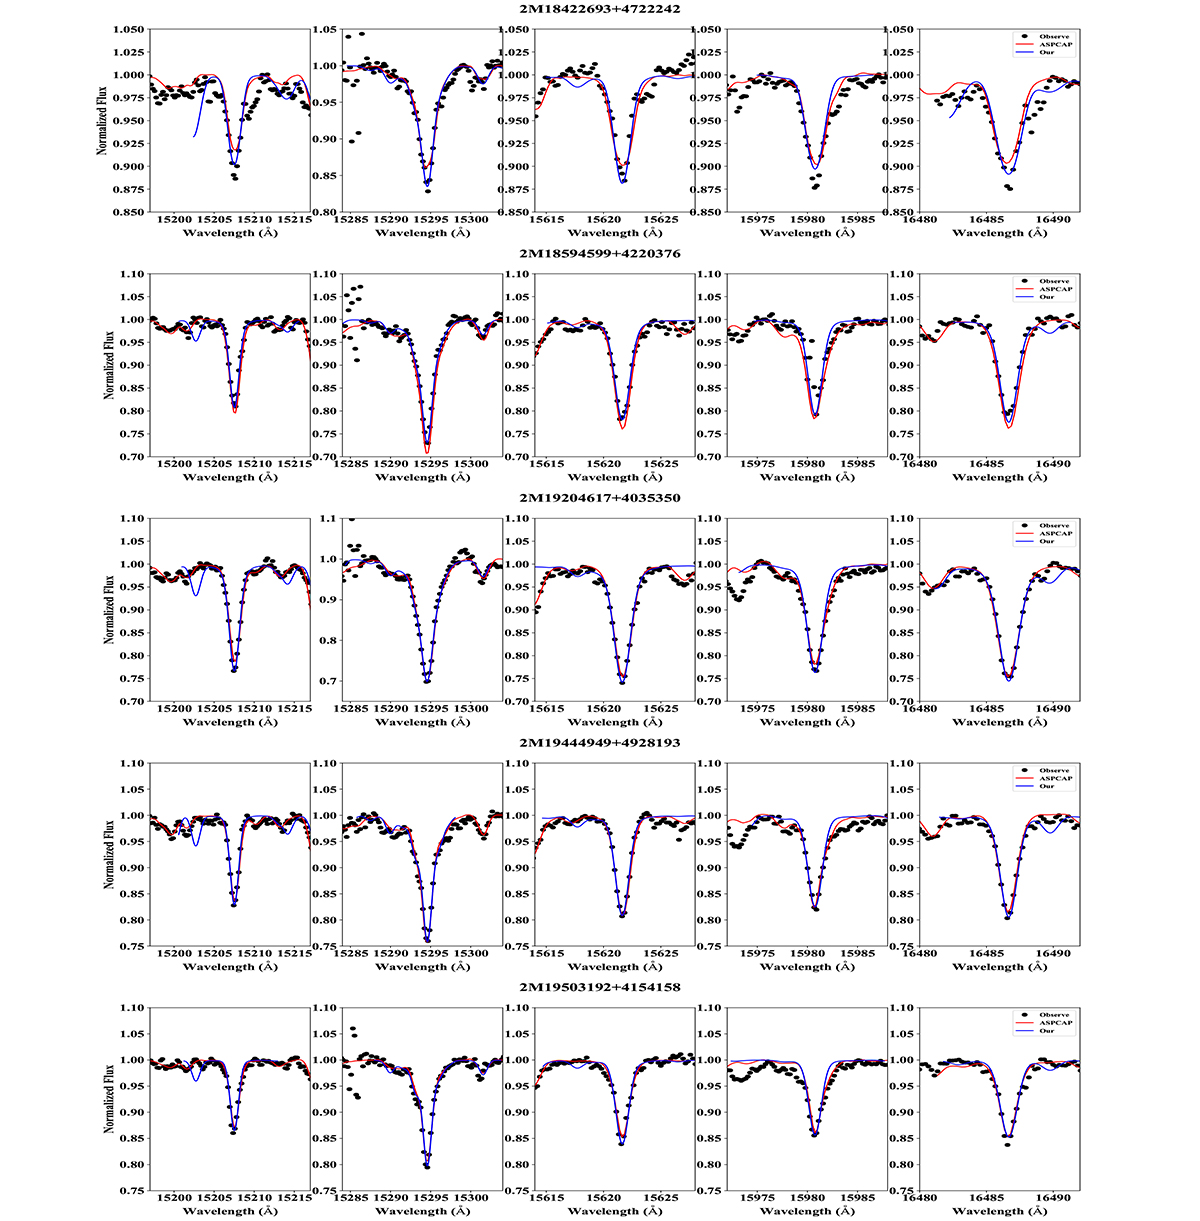
Fig. A.1.
Download original image
Comparison of the spectrum fitting between our method and that of ASPCAP. Five stars whose difference of v sin i is larger than 5 km s−1 are plotted. Each row shows a star including five Fe I lines that exhibit minimal blending. Blue lines represent the our best-fit. Red lines represent the best-fit of ASPCAP.
Current usage metrics show cumulative count of Article Views (full-text article views including HTML views, PDF and ePub downloads, according to the available data) and Abstracts Views on Vision4Press platform.
Data correspond to usage on the plateform after 2015. The current usage metrics is available 48-96 hours after online publication and is updated daily on week days.
Initial download of the metrics may take a while.