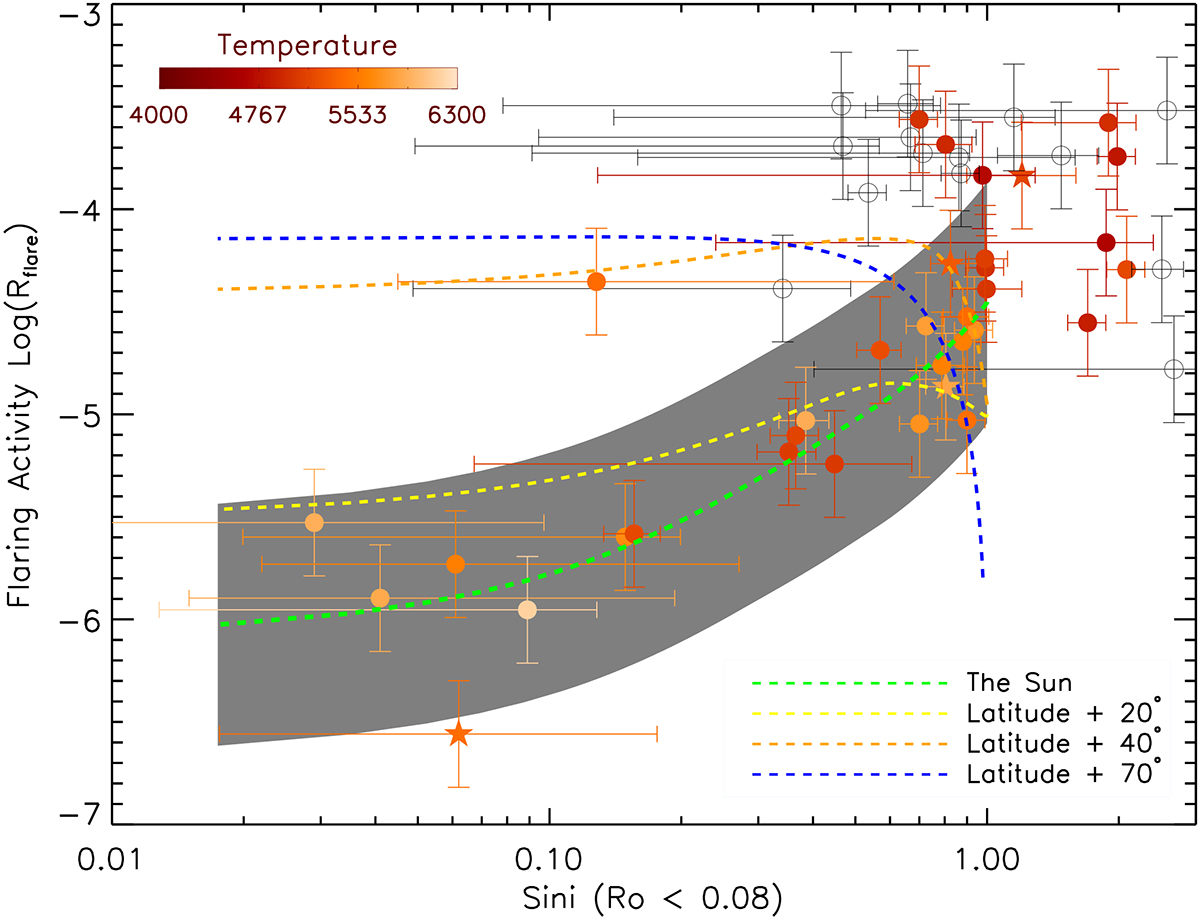
Fig. 6.
Download original image
Relation between flaring activity and inclination in the saturated regime (Ro < 0.08). Circles denote dwarfs, and five-pointed stars denote subgiants. Open circles represent M-type stars. The green line denotes the variation in the solar flaring with the inclination and the shaded region represents the uncertainty caused by the maximum and minimum of the solar cycle. The other three dashed lines denote the variation caused by the mock data and correspond to the flaring region distribution at mid latitude(+20°), high latitude (+40°), and polar region (+70°), respectively. All the dashed lines have been shifted vertically for a comparison.
Current usage metrics show cumulative count of Article Views (full-text article views including HTML views, PDF and ePub downloads, according to the available data) and Abstracts Views on Vision4Press platform.
Data correspond to usage on the plateform after 2015. The current usage metrics is available 48-96 hours after online publication and is updated daily on week days.
Initial download of the metrics may take a while.