Open Access
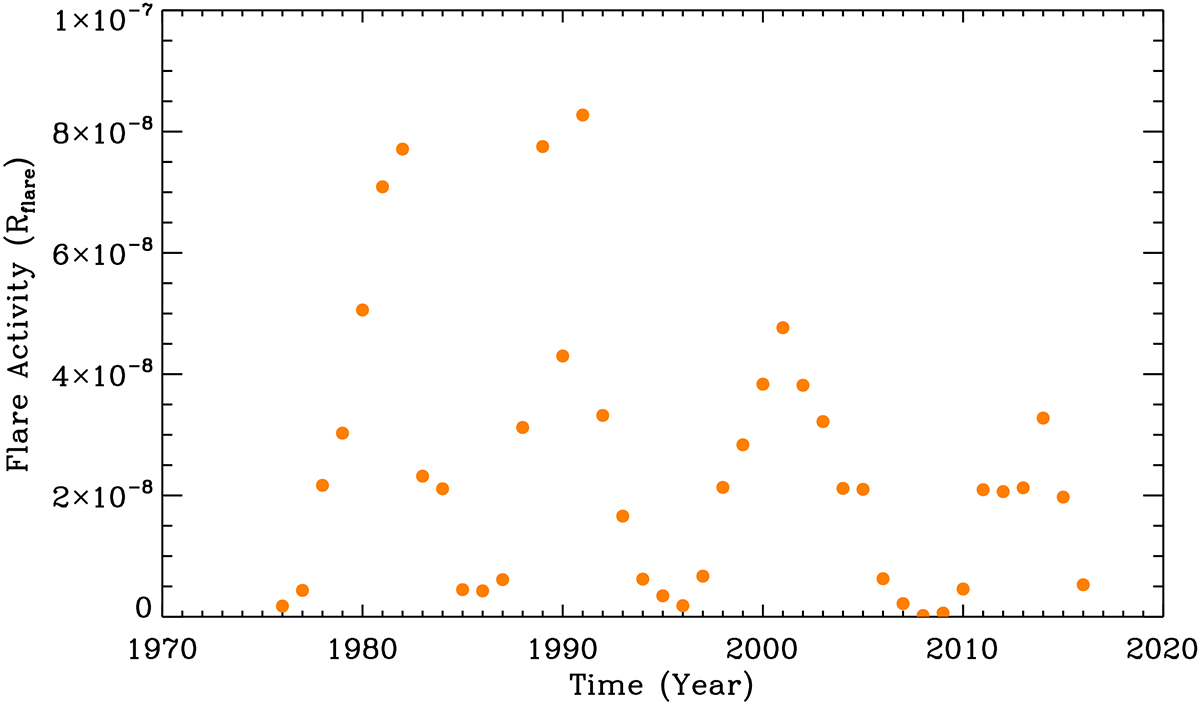
Fig. 4.
Download original image
Flaring activity of the Sun from 1975 to 2017. The solar flare energies are estimated based on the GOES SXR data (Eq. (2)). The variation in the flaring activity shows an 11-year cycle.
Current usage metrics show cumulative count of Article Views (full-text article views including HTML views, PDF and ePub downloads, according to the available data) and Abstracts Views on Vision4Press platform.
Data correspond to usage on the plateform after 2015. The current usage metrics is available 48-96 hours after online publication and is updated daily on week days.
Initial download of the metrics may take a while.