Fig. 3.
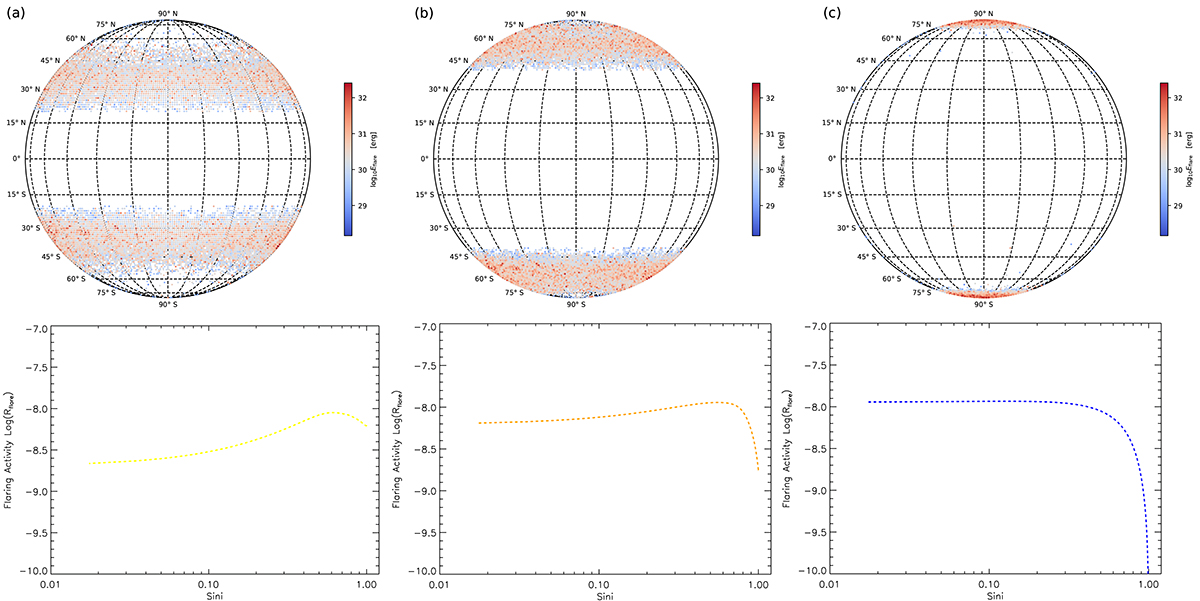
Download original image
Flaring activity vs. inclination for different LDARs. The top panels show the flaring region at mid latitude, high latitude, and the polar region. The different flaring regions are created by increasing the latitude of solar flares by 20°, 40°, and 70°, respectively. The bottom panels show the relation between the flaring activity and inclination for the corresponding flaring regions.
Current usage metrics show cumulative count of Article Views (full-text article views including HTML views, PDF and ePub downloads, according to the available data) and Abstracts Views on Vision4Press platform.
Data correspond to usage on the plateform after 2015. The current usage metrics is available 48-96 hours after online publication and is updated daily on week days.
Initial download of the metrics may take a while.