Fig. 2.
Download original image
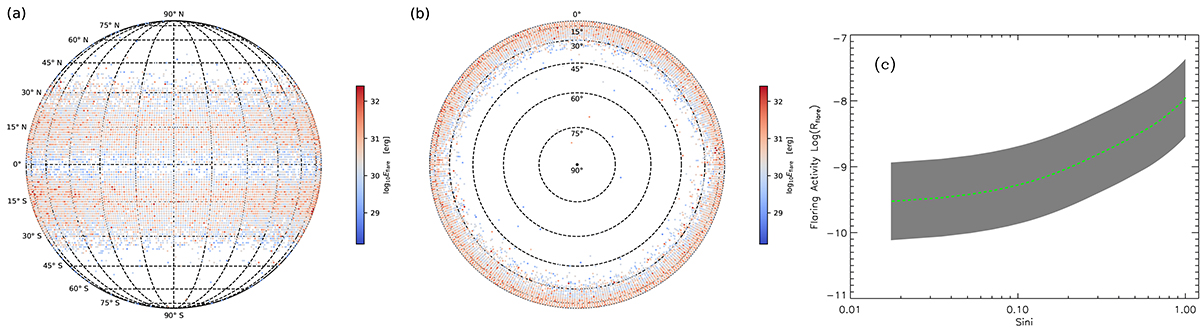
Panel a: About 38000 solar flares from 1975 to 2017 superimposed on the solar hemisphere that is observed from edge-on. Panel b: Same as (a) but observed from pole-on. Panel c: Observed flaring activity of the Sun varies with the inclination. The shaded region represents the uncertainty caused by the maximum and minimum of the solar cycle.
Current usage metrics show cumulative count of Article Views (full-text article views including HTML views, PDF and ePub downloads, according to the available data) and Abstracts Views on Vision4Press platform.
Data correspond to usage on the plateform after 2015. The current usage metrics is available 48-96 hours after online publication and is updated daily on week days.
Initial download of the metrics may take a while.