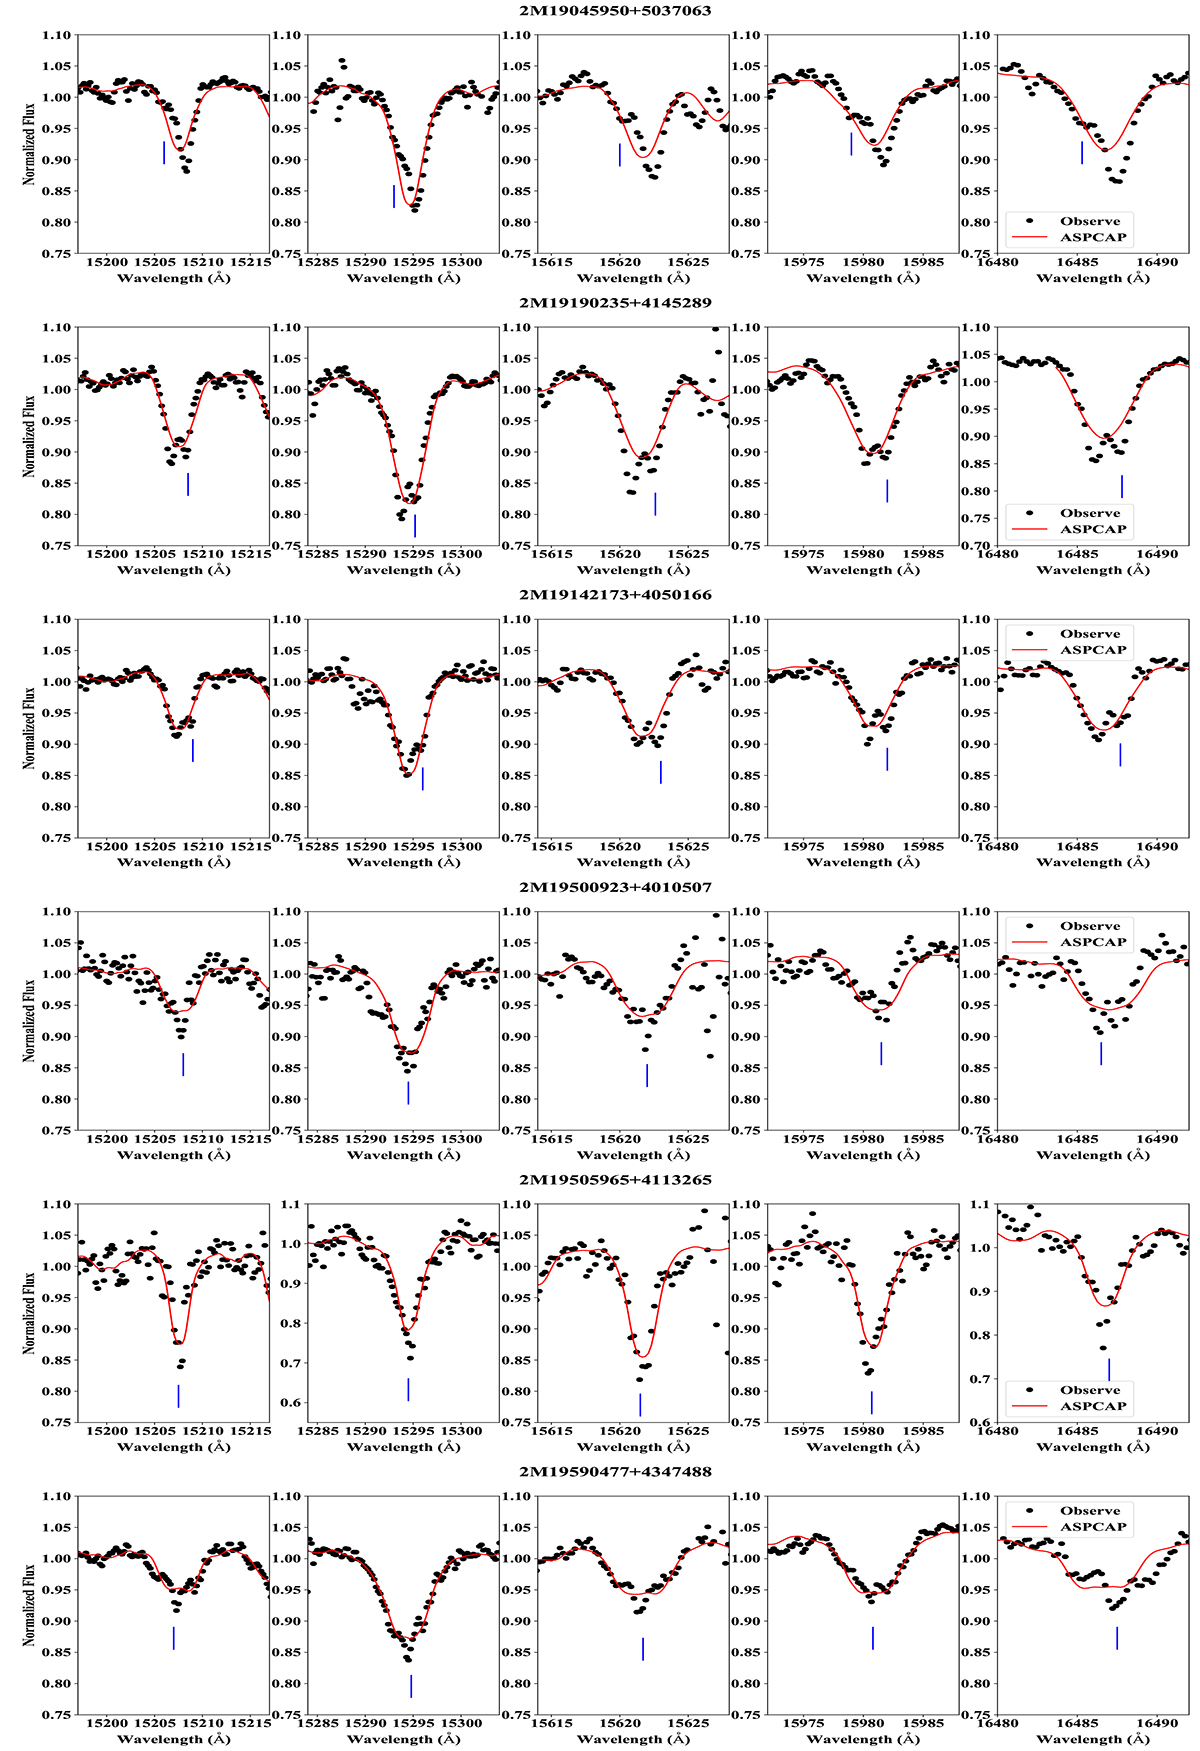
Fig. A.2.
Download original image
Illustrated examples of six visual SB2s identified in our sample. Each row shows a star including five Fe I lines that exhibit minimal blending. The vertical blue lines denote the possible companion feature. Red line represent the best-fit of ASPCAP. Those six binaries are plotted with triangle in Fig. 1, but are not included in the further analysis.
Current usage metrics show cumulative count of Article Views (full-text article views including HTML views, PDF and ePub downloads, according to the available data) and Abstracts Views on Vision4Press platform.
Data correspond to usage on the plateform after 2015. The current usage metrics is available 48-96 hours after online publication and is updated daily on week days.
Initial download of the metrics may take a while.