Fig. 1.
Download original image
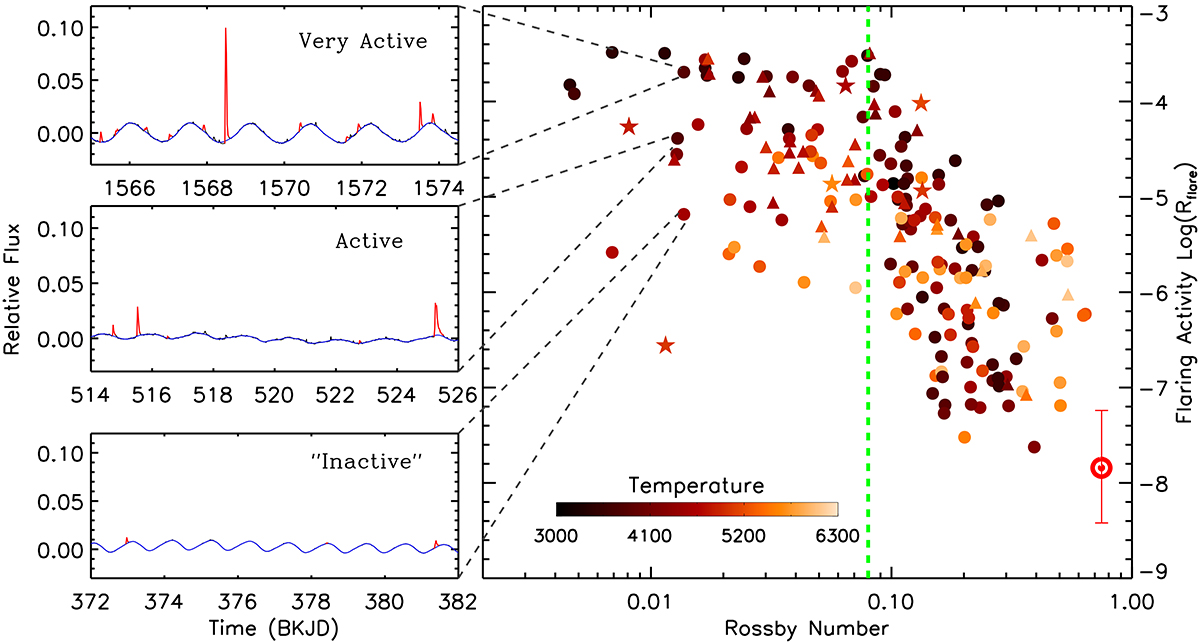
Left panels: Example of flaring stars with different activity levels. Red curves denote flares. Blue curves are fitted baselines. Black curves are the relative flux. Right panel: Rotation–flaring activity relationship. The x axis is the Rossby number (Ro; the ratio of the rotation period to the global convective turnover time), which has removed the influence of stellar mass. The shapes refer to the following star types: circle = dwarf; triangle = binary; and five-pointed star = subgiant. The green line (Ro = 0.08) separates the saturated and unsaturated regimes. The Sun is marked with an ⊙ symbol.
Current usage metrics show cumulative count of Article Views (full-text article views including HTML views, PDF and ePub downloads, according to the available data) and Abstracts Views on Vision4Press platform.
Data correspond to usage on the plateform after 2015. The current usage metrics is available 48-96 hours after online publication and is updated daily on week days.
Initial download of the metrics may take a while.