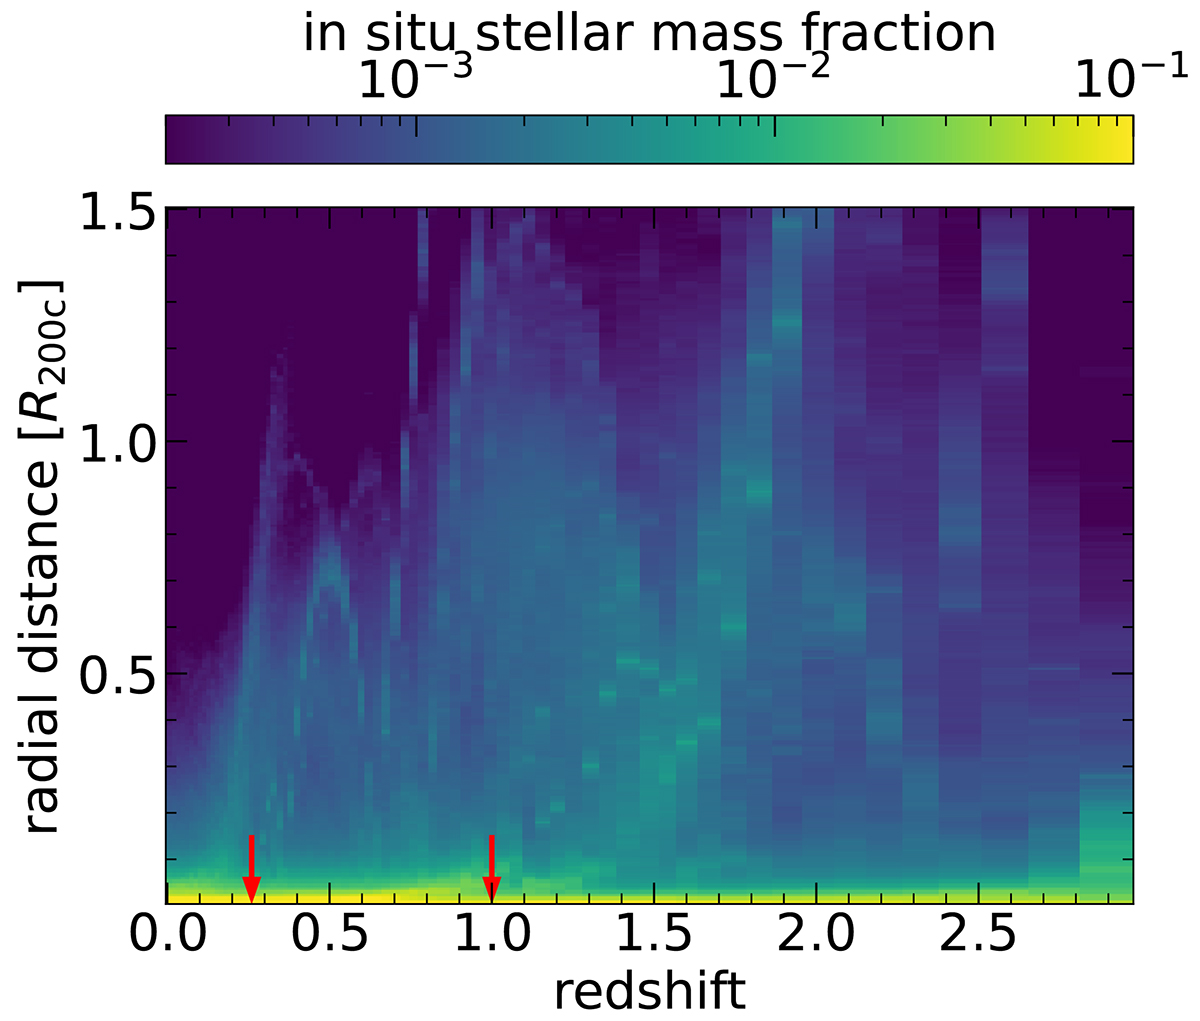
Fig. 4.
Download original image
Temporal evolution of the radial profile of the (z = 0) in situ mass fraction, for a single galaxy. The selected example is the same group-mass halo as in Fig. 3. Here we show the fraction of tracers at a given redshift in each radial bin, i.e., each column is independently normalized to unity. Red arrows mark the redshifts of major mergers within the displayed time range. While the central regions are dominated by high in situ fractions at all redshifts, more complex features are visible at larger galactocentric radii, showcasing the heterogeneous nature of gas flows and baryonic accretion.
Current usage metrics show cumulative count of Article Views (full-text article views including HTML views, PDF and ePub downloads, according to the available data) and Abstracts Views on Vision4Press platform.
Data correspond to usage on the plateform after 2015. The current usage metrics is available 48-96 hours after online publication and is updated daily on week days.
Initial download of the metrics may take a while.